In our first post, Performance analysis and optimization of SAP SQL, we presented different approaches to performance analysis of SQLScript. While the EXPLAIN PLAN command can provide some initial clues, in my opinion there is a much better tool for performance analysis - PlanViz. It displays the execution plan in a graphical editor.
The graphical interface greatly facilitates analysis, especially for very large queries that involve multiple steps. PlanViz allows you to identify time consuming steps at a glance. Besides, you'll be able to check how much data is being processed and see if the processing is done in parallel. Using the information provided, you can also see whether only the tables that are actually required are being read or whether too many data records have been selected.
Our blog series "SQLScript Performance Analysis" at a glance
|
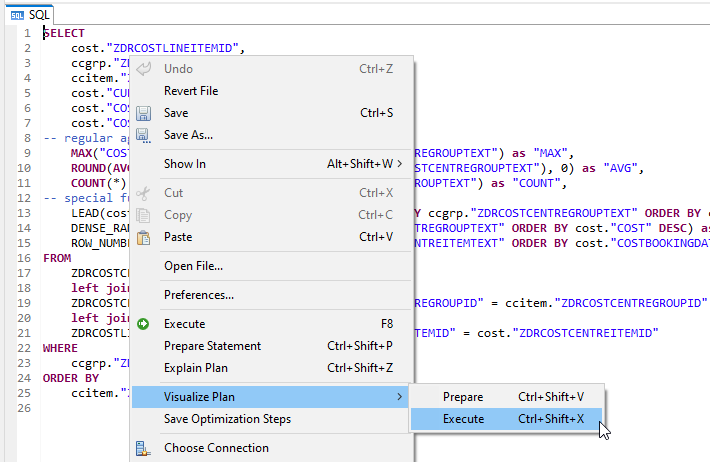
You can open PlanViz in Eclipse by right-clicking on the code. To do so, select Visualize Plan → Execute from the context menu.
Eclipse switches to the PlanViz perspective. First an overview with the execution time, the most important operators and the data flow is displayed.

To get more details about an operator, you can click on it. Under Number of Tables Used you can see how many tables are read in total. If you click on the number, you can see the tables used and the number of entries read.
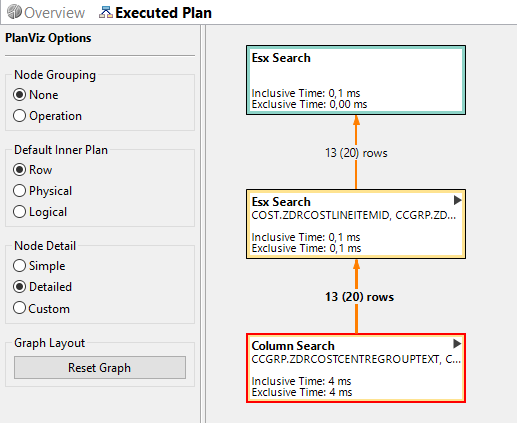
Under the Executed Plan menu item you can see a graphical representation of the execution plan. Each node represents an operation and the arrows show the data flow between the operations. Two execution times are displayed for each node: inclusive and exclusive time. The inclusive time corresponds to the execution time of the entire node. The exclusive time, on the other hand, shows only the runtime of the respective operation.
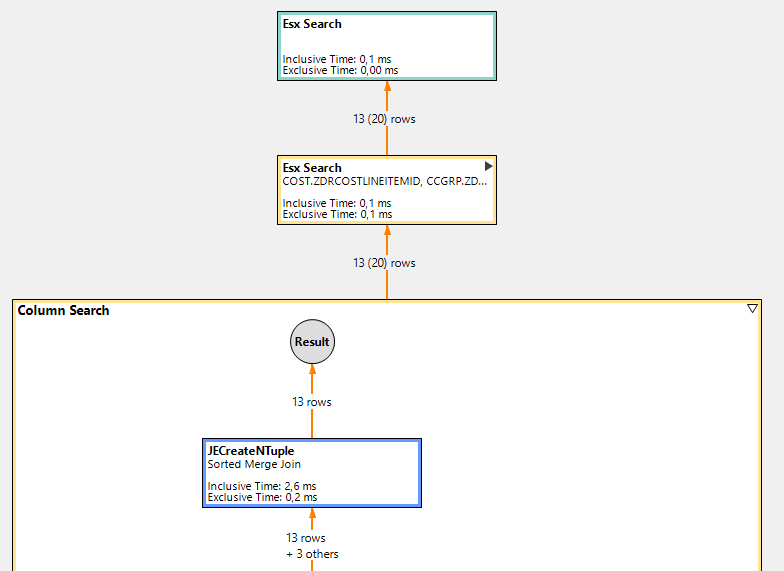
You can expand or collapse details of the respective nodes via the triangle. In the collapsed state, the displayed runtime corresponds to the sum of the underlying nodes. In the expanded state, you can see further information. For example, you can see that if you switch between the different engines, the result is materialized. Since this requires additional resources, this step should be avoided if possible.
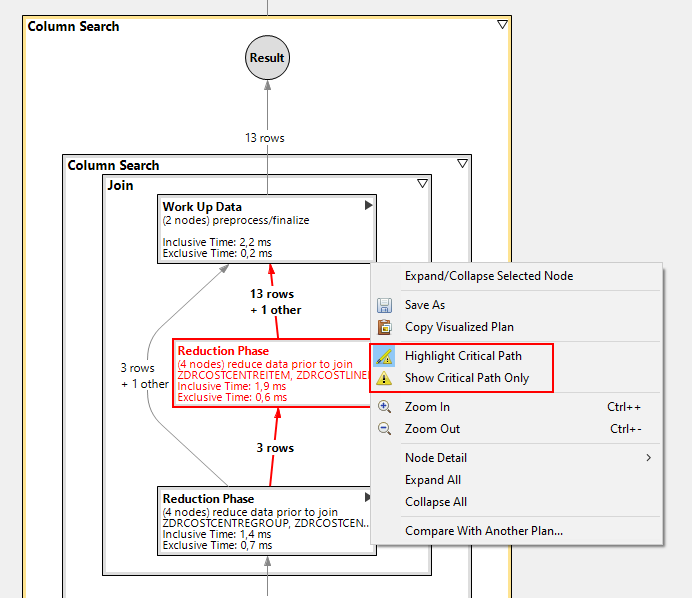
In addition, you can display the critical path. The operators that lie on the critical path should be primarily considered for performance optimization. Optimizations that are off the critical path have no impact on overall performance and are therefore secondary.
However, the representation of the data flow can quickly become confusing, especially with more complex SQL queries. For better analysis, PlanViz also provides information in table format, which can be found at the bottom of the tool: Timeline, Operator List, Tables Used as well as Performance Trace. In the following We will present these views in more detail.
Increase the performance of your BW with SQLScript!
Click here for the whitepaper!
Timeline
The Timeline view provides a complete overview of the execution plan, where the individual operations are placed on a timeline. This allows you to see at a glance if and which operations are being processed sequentially instead of in parallel. In addition, you can find other causes of long-running queries by identifying operations that take up the most runtime and comparing them to your expectations.
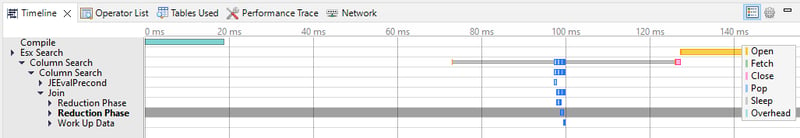
The view provides the following information. The X-axis displays the elapsed time since the query was executed. The Y-axis represents a list of the executed operations. The duration of the execution is displayed in the form of a Gantt chart. In addition, you can see the type of each timestamp, for example, whether it is an open, close or fetch step.
If you notice gaps or multiple occurrences of open or fetch statements in the row engine, this indicates that another operation was called by the column engine in the meantime. As you have already learned in our article SQLScript Performance Tips, switching between engines has a negative impact on performance, since the results have to be materialized.
Operator List
The Operator List view provides extended insights into all operators of the execution plan. This view offers much more details than the EXPLAIN FOR functionality we presented in the article Performance analysis and optimization of SAP SQL.
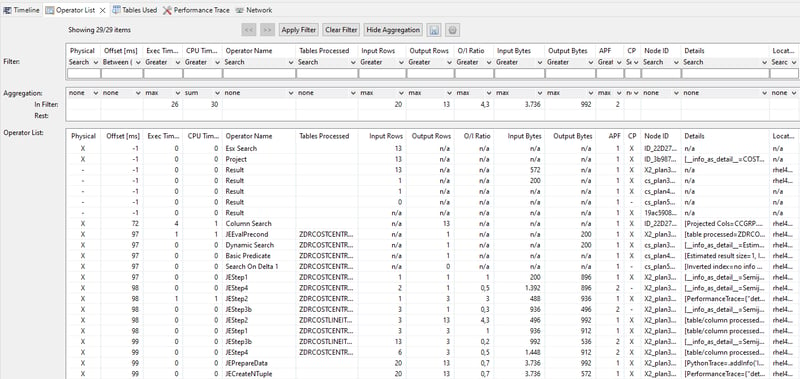
Especially useful is the possibility to filter the presented data according to certain criteria. For example, under the CP (critical path) column you can see whether the operator is on the critical path. Using a critical path filter, you can focus your analysis on the most important operators.
In addition, you can use the filter to view all operators that process a certain number of rows. Alternatively, you can only look at the long running operations by using the filter for execution time.
This allows you to focus your analysis on the essentials. Double-clicking on an entry takes you to this operator in the graphic display.
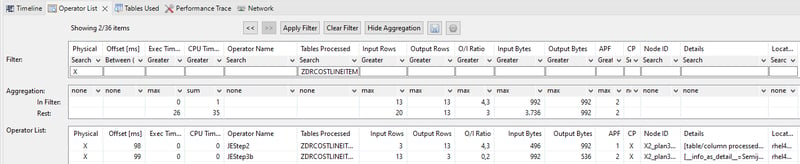
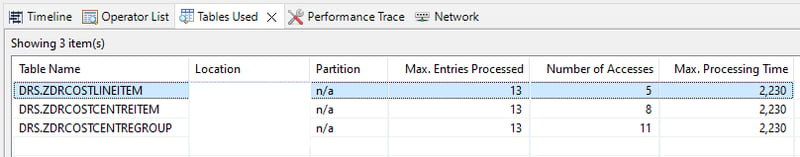
Tables Used
This view provides an overview of the tables used during the processing of your SQL query. Three key figures are displayed per table: maximum number of processed entries, number of accesses and maximum processing time. You can sort the content in ascending or descending order to identify outliers faster.
Here you can see at a glance whether the processed tables and the number of entries make sense. For example, if you discover a table that is not needed from the business point of view, you can adjust your SQL logic so that the table is not accessed. In addition, you can take a look at the number of entries processed. If the number of entries turns out to be higher than expected, check whether the filtering in your SQL query can be improved.
Double-clicking on a row takes you to the Operator List view, filtering on the specific table. This way you can see all operators working with this table.
Performance Trace
As the name suggests, this view is used for performance analysis. It shows a list of operators with the respective runtime and number of processed lines. This view consists of two areas. On the left, you see a list of operators that you can select. On the right, the performance trace data for the selected operator is displayed.
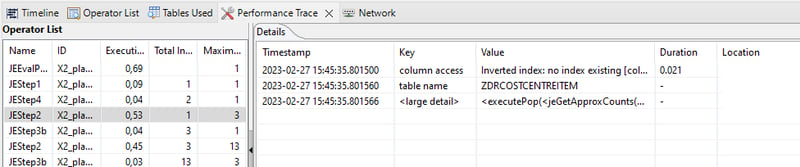
This view is primarily targeted at advanced users who are well acquainted with the details of SAP HANA. You can use this view to display additional information for a particular operator that is not available in other views. By looking at the sequential list of activities, you may be able to fill in the gaps in the Timeline view. In addition, you can view the detail of the engine execution.
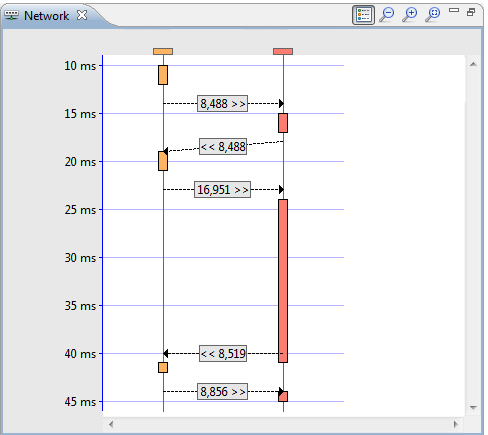
Network View
In the Network view, you can view the data transfers between different servers in your network. You can use this view to identify any problems with your distributed environment.
For example, if you notice that a particular data transfer takes an unusually long time, you can check the data size as well as the network. If you find that there are frequent data transfers between a certain group of servers, you can improve the setup.
PlanViz - Our Summary
We hope that you have now gained a basic understanding of how PlanViz works. It is a very powerful tool that allows you to analyze various performance aspects of your SQL queries.
Do you have questions about SAP HANA SQLScript? Are you trying to build up the necessary know-how in your department or do you need support with a specific question? We are happy to help you. Request a non-binding consulting offer today!