/Logo%202023%20final%20dunkelgrau.png?width=221&height=97&name=Logo%202023%20final%20dunkelgrau.png)


There are several ways to analyze SQLScript performance. In this article you will learn about the relevant tools. We will show you how to measure the runtime of your SQL queries, which can serve as a first indication of performance. Then we will explain how to use the execution plan to find out which part of the code is taking the longest.
With the PlanViz tool, you can also view the execution plan graphically and analyze individual steps. This option is available with Eclipse or HANA Studio as well as in web-based frontends such as SAP Business Application Studio. Finally, we will show you how to use the SQLScript Code Analyzer to scan your procedures and functions to generate suggestions for improvement.
Our blog series "SQLScript Performance Analysis" at a glance
|
Runtime measurement
The runtime of a SQL query can be used as a first indication of the script's performance. Especially if you compare two similar queries, the query with the lower runtime is the better performing one.
Note that the runtime of an SQLScript also depends on the general server load and can therefore fluctuate. In order to obtain representative results, you should therefore execute the SQL script several times and then compare the measurement results.
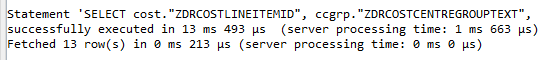
Let's consider the following example, which we presented in our post "How to use Window Functions in SQLScript". First, we run the query with the WHERE clause.
SELECT

    cost."ZDRCOSTLINEITEMID",

    ccgrp."ZDRCOSTCENTREGROUPTEXT",

    ccitem."ZDRCOSTCENTREITEMTEXT",

    cost."CURRENCY",

    cost."COST",

    cost."COSTBOOKINGDATE",

-- regular aggregations

    MAX("COST") OVER (PARTITION BY ccgrp."ZDRCOSTCENTREGROUPTEXT") as "MAX",

    ROUND(AVG("COST") OVER (PARTITION BY ccgrp."ZDRCOSTCENTREGROUPTEXT"), 0) as "AVG",

    COUNT(*) OVER (PARTITION BY ccgrp."ZDRCOSTCENTREGROUPTEXT") as "COUNT",

-- special functions

    LEAD(cost."COSTBOOKINGDATE", 1) OVER (PARTITION BY ccgrp."ZDRCOSTCENTREGROUPTEXT" ORDER BY ccitem."ZDRCOSTCENTREITEMTEXT", cost."COSTBOOKINGDATE") as "LEAD",

    DENSE_RANK() OVER (PARTITION BY ccgrp."ZDRCOSTCENTREGROUPTEXT" ORDER BY cost."COST" DESC) as "D_RANK",

    ROW_NUMBER() OVER (PARTITION BY ccitem."ZDRCOSTCENTREITEMTEXT" ORDER BY cost."COSTBOOKINGDATE") as "ROWNUM"

FROM

    ZDRCOSTCENTREGROUP as ccgrp

    left join

    ZDRCOSTCENTREITEM as ccitem on ccgrp."ZDRCOSTCENTREGROUPID" = ccitem."ZDRCOSTCENTREGROUPID"

    left join

    ZDRCOSTLINEITEM as cost on ccitem."ZDRCOSTCENTREITEMID" = cost."ZDRCOSTCENTREITEMID"

WHERE

    ccgrp."ZDRCOSTCENTREGROUPTEXT" = 'Administration'

ORDER BY

    ccitem."ZDRCOSTCENTREITEMTEXT", cost."COSTBOOKINGDATE";
The runtime and the number of selected rows are displayed in the SQL console.
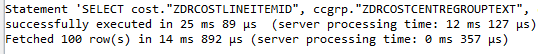
Now we execute the same query without the WHERE clause. So all data will be selected. From the SQL console we can see that the runtime is almost double. Whereby the server processing time is increased tenfold. Also ten times as many rows are selected.
Generate execution plan
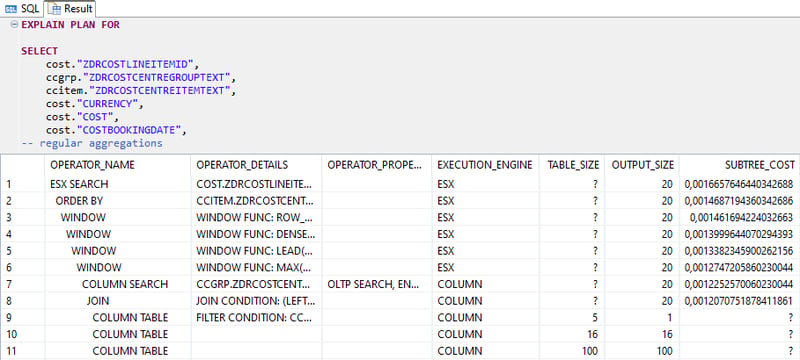
The EXPLAIN PLAN command allows you to generate an execution plan of your SQL query in tabular form. This will display a list of operators used by the database to execute the query, as well as supplementary information about them. This way you can find out which operators are responsible for the long runtime. This information can be used to optimize the query, for example, by reducing the runtime or memory consumption.
The execution plan can be generated using the following syntax:
EXPLAIN PLAN [SET STATEMENT_NAME = *<statement_name>*] FOR SELECT *<subquery>*
If you specify the statement, the result is stored in the explain_plan_table table.
EXPLAIN PLAN SET STATEMENT_NAME = 'MyStatement01' FOR

SELECT

    cost."ZDRCOSTLINEITEMID",

    ccgrp."ZDRCOSTCENTREGROUPTEXT",...

This table can be read out subsequently:

SELECT * FROM

explain_plan_table

WHERE

           statement_name = 'MyStatement01'
Alternatively, the execution plan can be created directly at runtime by omitting the SET STATEMENT_NAME parameter. The execution plan is displayed in the Result window. You can also enter multiple queries separated by a semicolon to generate multiple execution plans simultaneously.
EXPLAIN PLAN FOR

SELECT

    cost."ZDRCOSTLINEITEMID",

    ccgrp."ZDRCOSTCENTREGROUPTEXT",

    ccitem."ZDRCOSTCENTREITEMTEXT",

    cost."CURRENCY",

    cost."COST",

    cost."COSTBOOKINGDATE",

-- regular aggregations

    MAX("COST") OVER (PARTITION BY ccgrp."ZDRCOSTCENTREGROUPTEXT") as "MAX",

    ROUND(AVG("COST") OVER (PARTITION BY ccgrp."ZDRCOSTCENTREGROUPTEXT"), 0) as "AVG",

    COUNT(*) OVER (PARTITION BY ccgrp."ZDRCOSTCENTREGROUPTEXT") as "COUNT",

-- special functions

    LEAD(cost."COSTBOOKINGDATE", 1) OVER (PARTITION BY ccgrp."ZDRCOSTCENTREGROUPTEXT" ORDER BY ccitem."ZDRCOSTCENTREITEMTEXT", cost."COSTBOOKINGDATE") as "LEAD",

    DENSE_RANK() OVER (PARTITION BY ccgrp."ZDRCOSTCENTREGROUPTEXT" ORDER BY cost."COST" DESC) as "D_RANK",

    ROW_NUMBER() OVER (PARTITION BY ccitem."ZDRCOSTCENTREITEMTEXT" ORDER BY cost."COSTBOOKINGDATE") as "ROWNUM"

FROM

    ZDRCOSTCENTREGROUP as ccgrp

    left join

    ZDRCOSTCENTREITEM as ccitem on ccgrp."ZDRCOSTCENTREGROUPID" = ccitem."ZDRCOSTCENTREGROUPID"

    left join

    ZDRCOSTLINEITEM as cost on ccitem."ZDRCOSTCENTREITEMID" = cost."ZDRCOSTCENTREITEMID"

WHERE

    ccgrp."ZDRCOSTCENTREGROUPTEXT" = 'Administration'

ORDER BY

    ccitem."ZDRCOSTCENTREITEMTEXT", cost."COSTBOOKINGDATE";
Increase the performance of your BW with SQLScript!
Click here for the whitepaper!
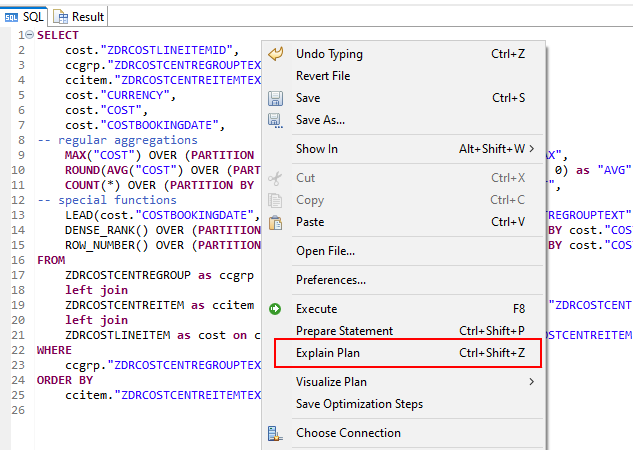
Alternatively, you can right-click on the code in Eclipse and select Explain Plan from the menu.
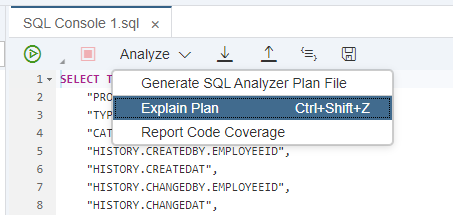
In the SAP HANA Database Explorer, you can find this option under the Analyze drop-down menu.
PlanViz
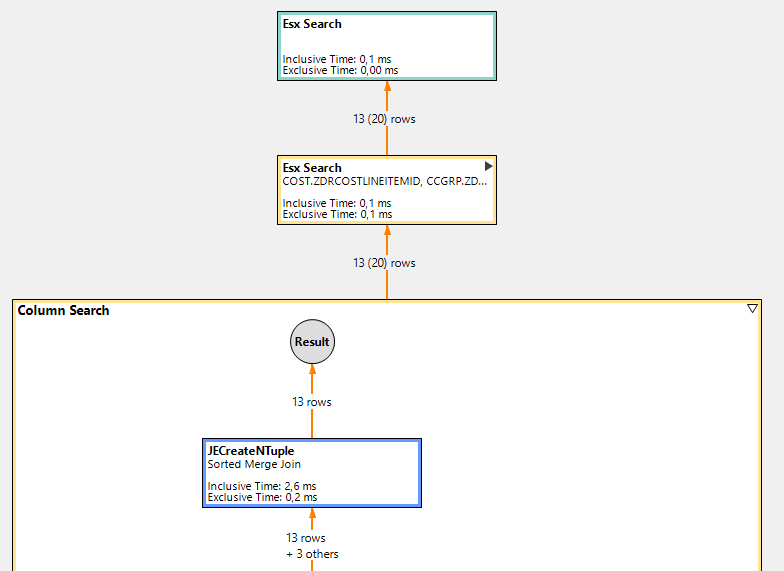
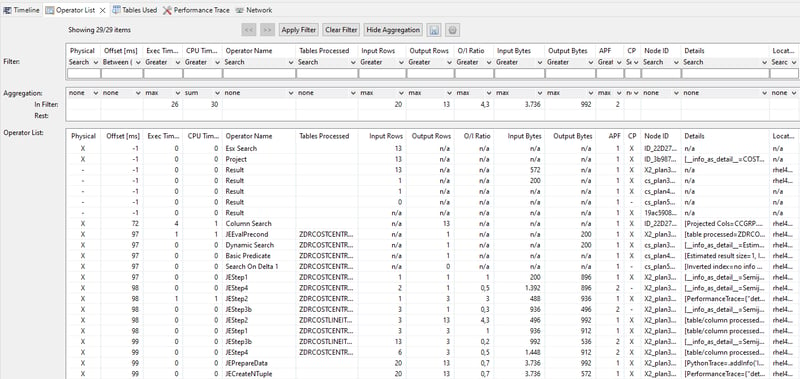
Explain Plan provides initial approaches to performance analysis. However, in my opinion, there is a much better tool that makes Explain Plan obsolete - PlanViz. Unlike Explain Plan, PlanViz presents the execution steps graphically, which makes analysis much easier. After the initial analysis of the aggregated steps, you can dive deeper into the details and look at the individual operators.
At the same time, the tabular view is not lost. PlanViz offers five tabular views in addition to the graphical view. In these you can view details about timeline, operators, tables and performance as well as network.
Since this is a really powerful and extensive tool, we have summarized further information in a separate article - SQL Performance Analysis withSAP PlanViz.
SQLScript Code Analyzer
While PlanViz is useful for post factum analysis, SQLScript Code Analyzer is used to examine your SQL functions and procedures for potential code quality, security and performance issues. By ensuring clean code, you can prevent performance problems in the first place.
For this purpose, SAP delivers two procedures that can analyze the source code of your functions and procedures: ANALYZE_SQLSCRIPT_OBJECTS and
ANALYZE_SQLSCRIPT_DEFINITION. The ANALYZE_SQLSCRIPT_OBJECTS procedure is used to analyze existing objects. Alternatively, ANALYZE_SQLSCRIPT_DEFINITION can be used to examine the source code for potential improvements before the function or procedure is created.
Web Tools
The tools described above primarily refer to the Eclipse or HANA Studio environment. However, in addition to these, web-based tools can also be used for performance analysis. For example, the Explain Plan functionality is also available in the HANA Database Explorer.
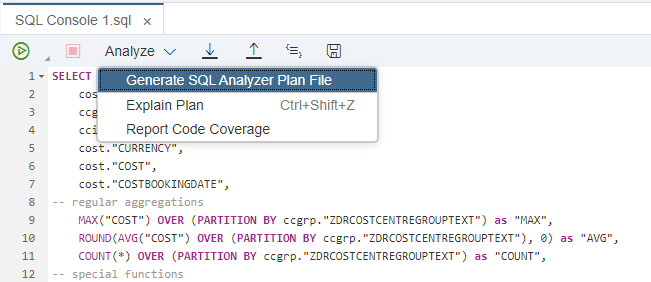
You can also use the Generate SQL Analyzer Plan File menu item to generate the plv files. These are stored under "Database Diagnostic Files" and can be opened with Eclipse in the PlanViz perspective. Alternatively, you can also use the integrated SQL Analyzer for this.
In addition, you can generate the plv files via the Generate SQL Analyzer Plan File menu item. These are stored under "Database Diagnostic Files" and can be opened with Eclipse in the PlanViz perspective. Alternatively, you can also use the integrated SQL Analyzer for this purpose.
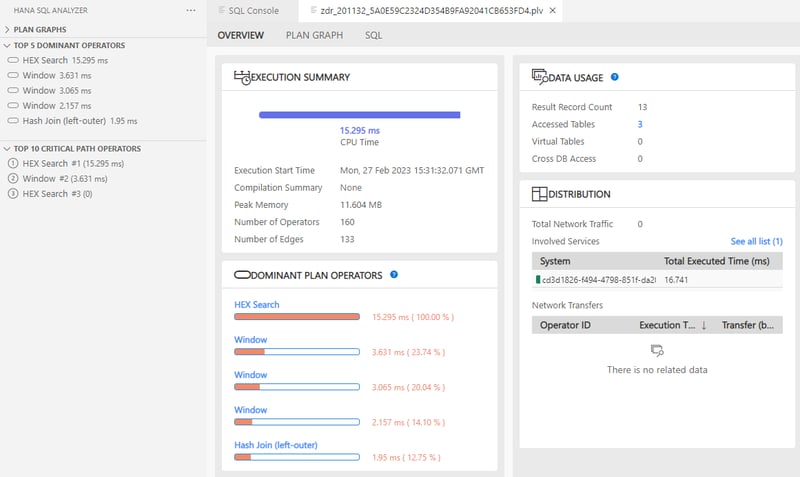
This tool is available both in the Web IDE and in the SAP Business Application Studio. SQL Analyzer is similar to the previously presented PlanViz. In addition to the graphical view, the tabular views provide more details about the operators, the sequence, the tables used and the number of table accesses.
Performance analysis and optimization - Our Summary
You now have an overview of the various options for SQLScript Performance Analysis. In the next article, SQL Performance Analysis withSAP PlanViz, we will introduce PlanViz in detail.
Do you have questions about SAP HANA SQLScript? Are you trying to build up the necessary know-how in your department or do you need support with a specific question? We are happy to help you. Request a non-binding consulting offer today!