Skip to content
NextLytics
Megamenü_2023_Über-uns

Shaping Business Intelligence

Whether clever add-on products for SAP BI, development of meaningful dashboards or implementation of AI-based applications - we shape the future of Business Intelligence together with you. 

Megamenü_2023_Über-uns_1

About us

As a partner with deep process know-how, knowledge of the latest SAP technologies as well as high social competence and many years of project experience, we shape the future of Business Intelligence in your company too.

Megamenü_2023_Methodik

Our Methodology

The mixture of classic waterfall model and agile methodology guarantees our projects a high level of efficiency and satisfaction on both sides. Learn more about our project approach.

Products
Megamenü_2023_NextTables

NextTables

Edit data in SAP BW out of the box: NextTables makes editing tables easier, faster and more intuitive, whether you use SAP BW on HANA, SAP S/4HANA or SAP BW 4/HANA.

Megamenü_2023_Connector

NextLytics Connectors

The increasing automation of processes requires the connectivity of IT systems. NextLytics Connectors allow you to connect your SAP ecosystem with various open-source technologies.

IT-Services
Megamenü_2023_Data-Science

Data Science & Engineering

Ready for the future? As a strong partner, we will support you in the design, implementation and optimization of your AI application.

Megamenü_2023_Planning

SAP Planning

We design new planning applications using SAP BPC Embedded, IP or SAC Planning which create added value for your company.

Megamenü_2023_Dashboarding

Dashboarding

We help you with our expertise to create meaningful dashboards based on Tableau, Power BI, SAP Analytics Cloud or SAP Lumira. 

Megamenü_2023_Data-Warehouse-1

SAP Data Warehouse

Are you planning a migration to SAP HANA? We show you the challenges and which advantages a migration provides.

Business Analytics
Megamenü_2023_Procurement

Procurement Analytics

Transparent and valid figures are important, especially in companies with a decentralized structure. SAP Procurement Analytics allows you to evaluate SAP ERP data in SAP BI.

Megamenü_2023_Reporting

SAP HR Reporting & Analytics

With our standard model for reporting from SAP HCM with SAP BW, you accelerate business activities and make data from various systems available centrally and validly.

Megamenü_2023_Dataquality

Data Quality Management

In times of Big Data and IoT, maintaining high data quality is of the utmost importance. With our Data Quality Management (DQM) solution, you always keep the overview.

Career
Megamenü_2023_Karriere-2b

Working at NextLytics

If you would like to work with pleasure and don't want to miss out on your professional and personal development, we are the right choice for you!

Megamenü_2023_Karriere-1

Senior

Time for a change? Take your next professional step and work with us to shape innovation and growth in an exciting business environment!

Megamenü_2023_Karriere-5

Junior

Enough of grey theory - time to get to know the colourful reality! Start your working life with us and enjoy your work with interesting projects.

Megamenü_2023_Karriere-4-1

Students

You don't just want to study theory, but also want to experience it in practice? Check out theory and practice with us and experience where the differences are made.

Megamenü_2023_Karriere-3

Jobs

You can find all open vacancies here. Look around and submit your application - we look forward to it! If there is no matching position, please send us your unsolicited application.

Blog
NextLytics Newsletter Teaser
Sign up now for our monthly newsletter!
Sign up for newsletter
 

How to visualize complex relationships with SAC value driver trees

With the help of value driver trees (VDT) in the SAP Analytics Cloud (SAC), you can display complex relationships in a graphical overview. In addition, you can easily run simulations. If you change a key figure, you can immediately see the effect on the overall result. In this article we take a closer look at the value driver trees (VDT) in SAC.

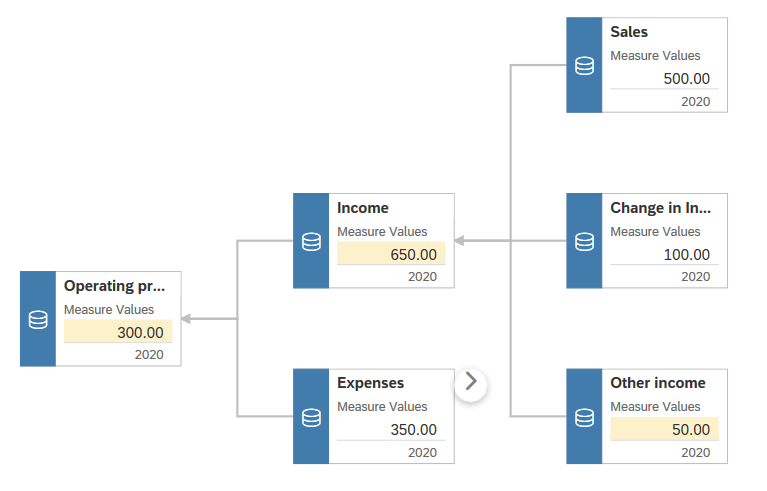
The value driver trees can be created very easily. You can either use the Value Driver Tree screen or insert the value driver trees directly into the story. When you define your tree, you can define the individual nodes manually, or you can have the system generate the complete value driver tree automatically using a hierarchy (such as the Profit & Loss hierarchy).

Value Driver Trees can be generated automatically

You can navigate very easily in the value driver trees. You can expand and collapse individual nodes, center the view around a particular node and also enlarge or reduce the view.

Value Driver Tree

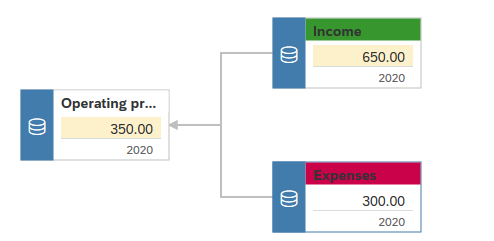
In addition, you can highlight individual nodes in color, for example, to distinguish expenses from revenues or to visually subdivide the value driver tree according to different product groups.

Highlighted nodes


Planning Tools compared - SAP BW IP vs. BPC vs. SAC

Neuer Call-to-Action


Value driver trees are ideally suited to perform quick simulations and thus show the effects of individual components of your scenario on the overall result.

Perform VDT Simulation

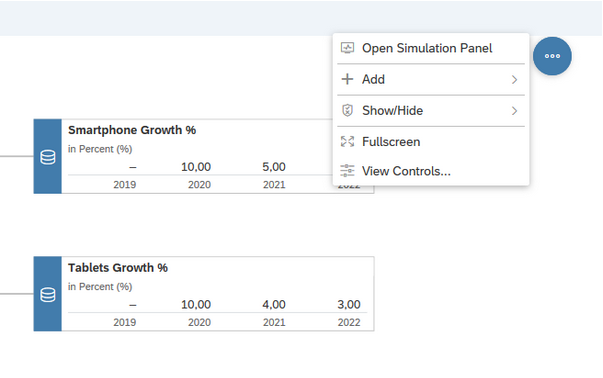
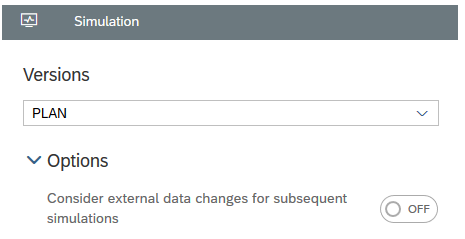
You can quickly switch between different versions to simulate several scenarios.

Different versions can be used for simulation

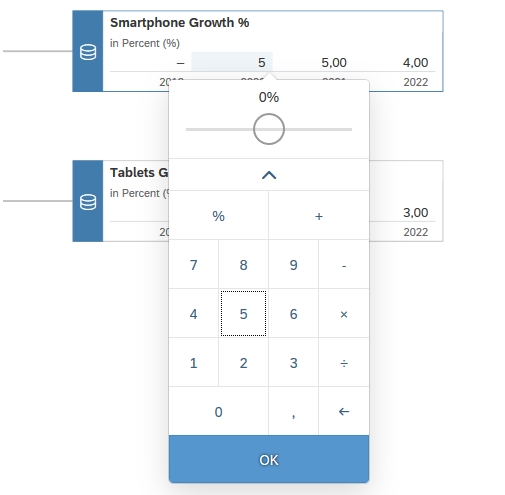
In your simulations, you can enter the values directly in the value driver tree or use the slider. Simple in-cell calculations, such as +10%, are also possible.

Perform In-Cell Calculations

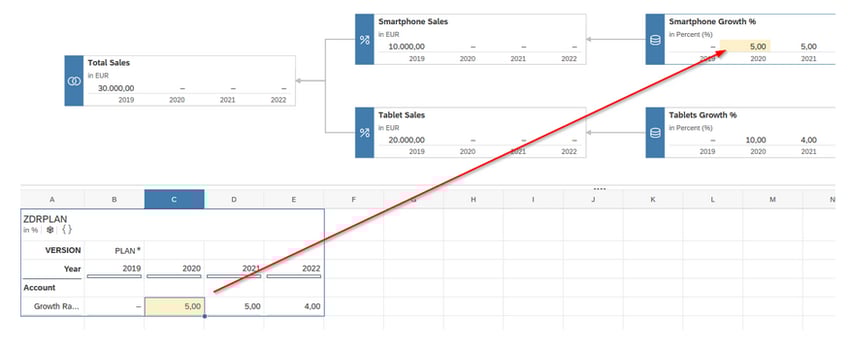
Furthermore, you can adjust the values in the table view and the changes are reflected directly in the value driver tree.

Adjust values in the table

Value driver trees offer a very good possibility to perform ad-hoc simulations and are also helpful in planning scenarios with many sub-accounts, such as P&L planning. However, there are also restrictions. For example, models in which variables are defined are currently not supported. You also don't have the option to apply conditional formatting, as known from Excel, to the nodes.

ValQ offers you these and many other functions. ValQ from Visual BI is the intelligent tool for the simple simulation of value driver trees in real time.

ValQ provides Smart Insights-like functions directly from the Value Driver Tree, whereas with SAC you must first switch to the table to use such a function. ValQ also provides conditional formatting of Value Driver Tree nodes. Furthermore, differences between different data versions (for example, actual vs. budget) are displayed immediately. With SAC, these must first be added separately as calculations. Furthermore, switching time periods in ValQ is much easier. To do this, simply use the integrated navigation panel. Furthermore, nodes can be easily expanded and collapsed without having to use the context menu (right click) as in SAC. Even the simulations can be done much easier and more intuitive by using a slider on the respective node directly. Finally, ValQ also offers composite nodes, which is not possible with SAC.

Further information about ValQ are available here: 

​Learn all about the simulation  of value driving KPIs with ValQ​


avatar

Chris

Chris Fidanidis has been working in the SAP BW environment since 2007. During these years he has implemented several planning projects and used various SAP tools such as SAP BSP, SAP BW-IP, SAP BPC, SAP BW Embedded BPC. He has gained experience primarily as a developer, architect, project manager and team leader. He enjoys playing basketball and barbecue whenever possible.

Got a question about this blog?
Ask Chris

Blog - NextLytics AG 

Welcome to our blog. In this section we regularly report on news and background information on topics such as SAP Business Intelligence (BI), SAP Dashboarding with Lumira Designer or SAP Analytics Cloud, Machine Learning with SAP BW, Data Science and Planning with SAP Business Planning and Consolidation (BPC), SAP Integrated Planning (IP) and SAC Planning and much more.

Subscribe to our newsletter

Related Posts

Recent Posts