Skip to content
NextLytics
Megamenü_2023_Über-uns

Shaping Business Intelligence

Whether clever add-on products for SAP BI, development of meaningful dashboards or implementation of AI-based applications - we shape the future of Business Intelligence together with you. 

Megamenü_2023_Über-uns_1

About us

As a partner with deep process know-how, knowledge of the latest SAP technologies as well as high social competence and many years of project experience, we shape the future of Business Intelligence in your company too.

Megamenü_2023_Methodik

Our Methodology

The mixture of classic waterfall model and agile methodology guarantees our projects a high level of efficiency and satisfaction on both sides. Learn more about our project approach.

Products
Megamenü_2023_NextTables

NextTables

Edit data in SAP BW out of the box: NextTables makes editing tables easier, faster and more intuitive, whether you use SAP BW on HANA, SAP S/4HANA or SAP BW 4/HANA.

Megamenü_2023_Connector

NextLytics Connectors

The increasing automation of processes requires the connectivity of IT systems. NextLytics Connectors allow you to connect your SAP ecosystem with various open-source technologies.

IT-Services
Megamenü_2023_Data-Science

Data Science & Engineering

Ready for the future? As a strong partner, we will support you in the design, implementation and optimization of your AI application.

Megamenü_2023_Planning

SAP Planning

We design new planning applications using SAP BPC Embedded, IP or SAC Planning which create added value for your company.

Megamenü_2023_Dashboarding

Dashboarding

We help you with our expertise to create meaningful dashboards based on Tableau, Power BI, SAP Analytics Cloud or SAP Lumira. 

Megamenü_2023_Data-Warehouse-1

SAP Data Warehouse

Are you planning a migration to SAP HANA? We show you the challenges and which advantages a migration provides.

Business Analytics
Megamenü_2023_Procurement

Procurement Analytics

Transparent and valid figures are important, especially in companies with a decentralized structure. SAP Procurement Analytics allows you to evaluate SAP ERP data in SAP BI.

Megamenü_2023_Reporting

SAP HR Reporting & Analytics

With our standard model for reporting from SAP HCM with SAP BW, you accelerate business activities and make data from various systems available centrally and validly.

Megamenü_2023_Dataquality

Data Quality Management

In times of Big Data and IoT, maintaining high data quality is of the utmost importance. With our Data Quality Management (DQM) solution, you always keep the overview.

Career
Megamenü_2023_Karriere-2b

Working at NextLytics

If you would like to work with pleasure and don't want to miss out on your professional and personal development, we are the right choice for you!

Megamenü_2023_Karriere-1

Senior

Time for a change? Take your next professional step and work with us to shape innovation and growth in an exciting business environment!

Megamenü_2023_Karriere-5

Junior

Enough of grey theory - time to get to know the colourful reality! Start your working life with us and enjoy your work with interesting projects.

Megamenü_2023_Karriere-4-1

Students

You don't just want to study theory, but also want to experience it in practice? Check out theory and practice with us and experience where the differences are made.

Megamenü_2023_Karriere-3

Jobs

You can find all open vacancies here. Look around and submit your application - we look forward to it! If there is no matching position, please send us your unsolicited application.

Blog
NextLytics Newsletter Teaser
Sign up now for our monthly newsletter!
Sign up for newsletter
 

Value Driver Tree: dimensional and templated nodes

Value driver trees are an ideal tool for modeling business scenarios and enable you to visualize the operating procedure and the most important key figures. Unlike traditional reports or dashboards, this visualization gives you much deeper insight and analysis. Why? Because it maps the relationship between different operational processes to your company's key indicators through a logical and/or mathematical linkage, which can include simulations and what-if scenarios.

One important feature for a good value driver tree is the flexibility to map all value-driving data in the tree structure. While traditional Value Driver Trees represent only the operational drivers and business KPIs, a really good model must include more analysis functions, such as the ability to penetrate one of the drivers and look at the key factors that contribute to the value of that driver.

The Value Driver Tree of Visual BI offers you exactly that possibility. You can use drilldwon to assign data to a specific node in the value driver tree using a "dimensional node". The Value Driver Tree also offers a useful node function for complex business forms: If your company has different business units, you can map around 80 percent of these value driver trees thanks to templated nodes and only have to enter the individual differences between the single units.

This article deals with the two central node functions of the Value Driver Tree Tool and how you can use them to create your value driver tree:

1. Dimensional Nodes
2. Templated Nodes

1. Create dimensional Nodes for deeper Insights

Imagine you have a value driver tree that breaks net profits down into revenues and cost types. The Value Driver Tree gives you a clear overview of the different factors that influence both revenues and cost types. However, if you want to gain a more detailed insight into what lies behind a more general factor such as "delay" for example, you can display the data behind it in a new window. To do this, the dimensional node must be supplied in advance with external data, for example from the SAP Business Warehouse. You then gain a much deeper insight into the underlying data and can analyze the various value-driving factors much more precisely. It makes sense to use drilldown in dimensional nodes, especially in value driver trees, which otherwise become too branched and confusing due to their abundance of elements.

Value Driver Tree dimensional nodes

In our example, we first created a "Dimensional Node" component within the Value Driver Tree Tool and used a BW data source to get the detail data of the internal delay into the component. We then included this dimension node component within the value driver tree model. If you want to view the detailed data, you only have to click on the "Table" icon next to the node. You see a pop-up window with the drilldown, which looks something like this:

Value Driver Tree drilldwon
Click on "Table" to open the drilldown with all important information.

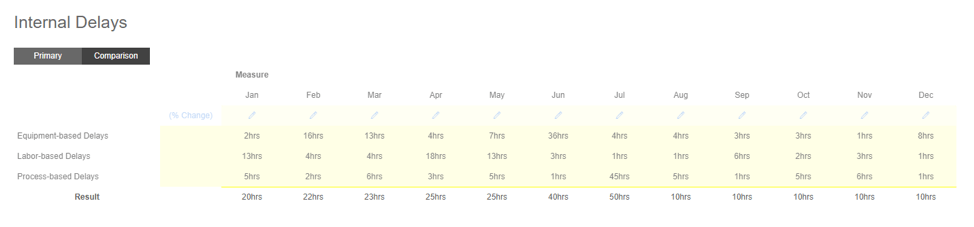
If necessary, a comparison series for each of the existing dimension elements can also be displayed on a separate tab without any major effort - it simply has to be integrated as part of the data source.

2. Integrate templated Nodes

Another important feature of the Value Driver Tree Tool is the use of node templates. With this function you can save a lot of work and time when creating value driver trees with similar basic requirements.

Assuming your company is divided into three different business units, you want to create a net profit value driver tree for all three. In the area of costs, you are likely to have identical nodes for all three. These can be, for example, the purchase price for raw materials, the production costs, or the costs for services. These are displayed as individual nodes in the Value Driver Tree and can still contain subnodes. If individual nodes and the data behind them are identical for your individual business units, it makes sense to simply adopt them for all units.

You can do this easily in the Value Driver Tree of Visual BI. Best of all, the underlying nodes can also be copied to other value driver trees as templates. This way you can easily transfer a large part of the value driver tree to be created from existing nodes and only have to individualize the last 10 to 20 percent.

The Value Driver Tree Tool offers a broad range of functions that facilitate the analysis and simulation of your company's value drivers.

Would you like to learn more about the various functions and advantages of the Value Driver Tree Tool? Then get in touch with us for a personal demonstration:

Neuer Call-to-Action

avatar

Sebastian

Sebastian Uhlig has been consulting companies in various industries on SAP BI solutions at national and international level since 2001 and covers the range from requirements analysis to the implementation of complex solutions. He has experience in leading project teams and is the architect of the product NextTables. He enjoys mountain biking and watching American football games.

Got a question about this blog?
Ask Sebastian

Blog - NextLytics AG 

Welcome to our blog. In this section we regularly report on news and background information on topics such as SAP Business Intelligence (BI), SAP Dashboarding with Lumira Designer or SAP Analytics Cloud, Machine Learning with SAP BW, Data Science and Planning with SAP Business Planning and Consolidation (BPC), SAP Integrated Planning (IP) and SAC Planning and much more.

Subscribe to our newsletter

Recent Posts