Skip to content
NextLytics
Megamenü_2023_Über-uns

Shaping Business Intelligence

Whether clever add-on products for SAP BI, development of meaningful dashboards or implementation of AI-based applications - we shape the future of Business Intelligence together with you. 

Megamenü_2023_Über-uns_1

About us

As a partner with deep process know-how, knowledge of the latest SAP technologies as well as high social competence and many years of project experience, we shape the future of Business Intelligence in your company too.

Megamenü_2023_Methodik

Our Methodology

The mixture of classic waterfall model and agile methodology guarantees our projects a high level of efficiency and satisfaction on both sides. Learn more about our project approach.

Products
Megamenü_2023_NextTables

NextTables

Edit data in SAP BW out of the box: NextTables makes editing tables easier, faster and more intuitive, whether you use SAP BW on HANA, SAP S/4HANA or SAP BW 4/HANA.

Megamenü_2023_Connector

NextLytics Connectors

The increasing automation of processes requires the connectivity of IT systems. NextLytics Connectors allow you to connect your SAP ecosystem with various open-source technologies.

IT-Services
Megamenü_2023_Data-Science

Data Science & Engineering

Ready for the future? As a strong partner, we will support you in the design, implementation and optimization of your AI application.

Megamenü_2023_Planning

SAP Planning

We design new planning applications using SAP BPC Embedded, IP or SAC Planning which create added value for your company.

Megamenü_2023_Dashboarding

Dashboarding

We help you with our expertise to create meaningful dashboards based on Tableau, Power BI, SAP Analytics Cloud or SAP Lumira. 

Megamenü_2023_Data-Warehouse-1

SAP Data Warehouse

Are you planning a migration to SAP HANA? We show you the challenges and which advantages a migration provides.

Business Analytics
Megamenü_2023_Procurement

Procurement Analytics

Transparent and valid figures are important, especially in companies with a decentralized structure. SAP Procurement Analytics allows you to evaluate SAP ERP data in SAP BI.

Megamenü_2023_Reporting

SAP HR Reporting & Analytics

With our standard model for reporting from SAP HCM with SAP BW, you accelerate business activities and make data from various systems available centrally and validly.

Megamenü_2023_Dataquality

Data Quality Management

In times of Big Data and IoT, maintaining high data quality is of the utmost importance. With our Data Quality Management (DQM) solution, you always keep the overview.

Career
Megamenü_2023_Karriere-2b

Working at NextLytics

If you would like to work with pleasure and don't want to miss out on your professional and personal development, we are the right choice for you!

Megamenü_2023_Karriere-1

Senior

Time for a change? Take your next professional step and work with us to shape innovation and growth in an exciting business environment!

Megamenü_2023_Karriere-5

Junior

Enough of grey theory - time to get to know the colourful reality! Start your working life with us and enjoy your work with interesting projects.

Megamenü_2023_Karriere-4-1

Students

You don't just want to study theory, but also want to experience it in practice? Check out theory and practice with us and experience where the differences are made.

Megamenü_2023_Karriere-3

Jobs

You can find all open vacancies here. Look around and submit your application - we look forward to it! If there is no matching position, please send us your unsolicited application.

Blog
NextLytics Newsletter Teaser
Sign up now for our monthly newsletter!
Sign up for newsletter
 

Three filter options in SAC Story and one alternative

In SAP Analytics Cloud Story, there are essentially three different filter options:

  • Filtering in the widget (charts, tables)
  • Page filter
  • Story filter

In this article I will deal with these filters and show you how you can implement them. Furthermore, I will show you an alternative, the so-called Linked Analysis. 

Widget filter

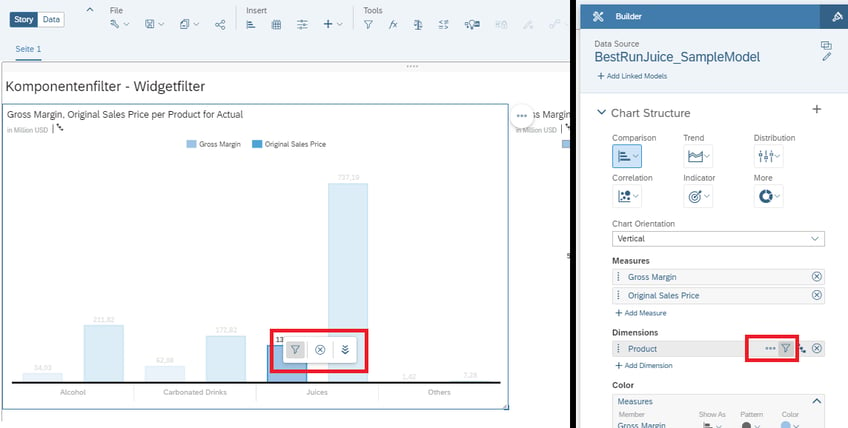
The easiest way to filter by characteristic values is the widget filter. Filtering is possible via the Builder Panel or directly via the widget (e.g. a bar chart). Especially in diagrams, values can be excluded ("X" next to the filter icon) in addition to filtering to individual values.

Filters in the Builder Panel cannot be influenced by the user, while changes can be adjusted intuitively directly in the widget.

Widget filter

Page filter

To guide the user more intuitively through the dashboard, there is also a page filter that filters individual values with the help of an optical input control. In this case it is possible to filter by characteristic values as well as by individual key figures. An advanced filter is also available for the characteristic values.

Note: A maximum of one key figure can be exchanged in the diagram for the key figures.

Dimensions

To add a page filter, an input control is added from the menu (section "Insert"). You can then filter by dimensions from the menu that opens. In the dialog window that opens, the values of the input control are edited. In addition to selecting the dimension values (members), it is also possible to display unbooked members or to define the filter settings for the user.

Pagefilter dialog

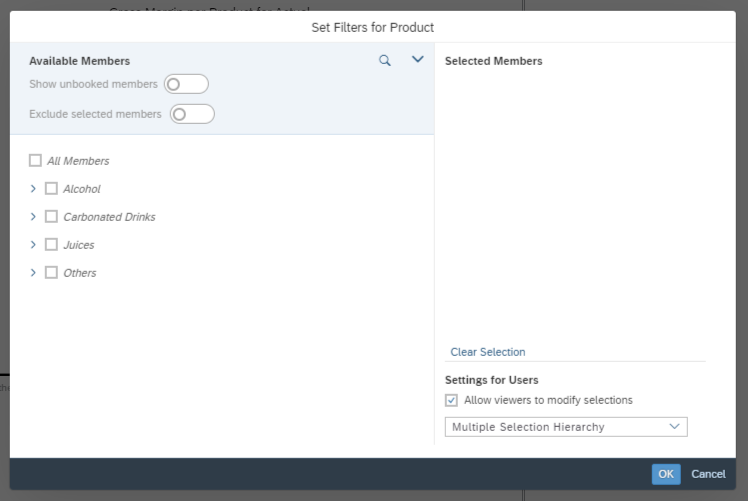
Tip: To make the selection boxes visible, the grey rectangle of the input filter at the lower right corner can be enlarged.
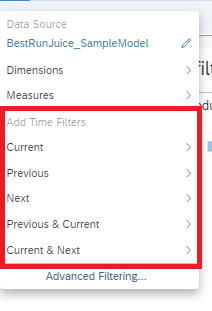
Pagefilter Input Control Check Boxes

New in Q4 2019

This release enables dynamic time filters. This means that you can filter dynamically according to the last or next period (year, quarter,...).
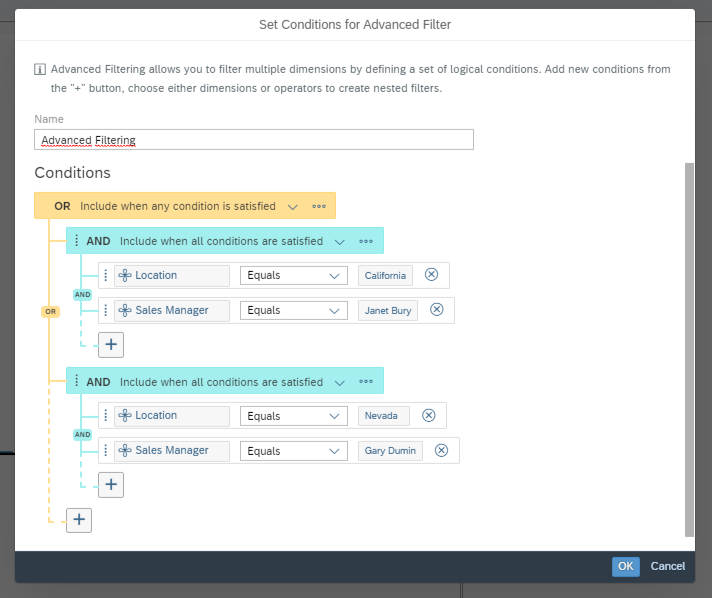
Dynamic Time fIlter

Advanced filters

Advanced filters are also possible for attributes. If a new input control is added, you can select "Advanced Filtering..." from the menu that opens (last entry) can be selected. This makes it possible to create more complex filter conditions. However, these conditions can only be viewed and adjusted by the creator and not by the user. This filter is comparable to the filter from the Builder Panel. 

Page filter advanced filtering

Measures

If the input control is added directly from the menu, measures can also be selected in the menu that opens. However, this filter refers to the definition of ranges and not to the selection of a single measure.


Dashboarding with SAP Analytics Cloud -
Download the whitepaper here!

SAP Analytics Cloud Whitepaper


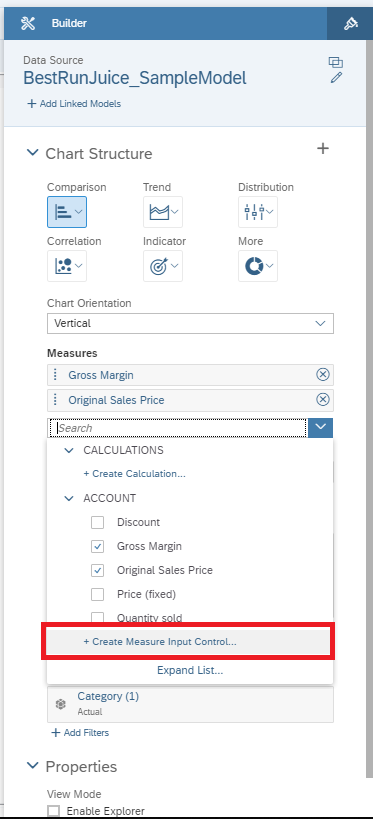
To add an input filter for a single key figure, select the penultimate entry "+ Create Measure Input Control" in the selection box for key figures in the Builder Panel. This filter can only be used to exchange one measure in the diagram at a time (multiple selection is not possible). In the dialog window, you can select the measures that are available to the user in the input control. 

Note: Do not select the same measures in the dialog box for the selection as in the Builder Panel, otherwise an error message will appear in the diagram.
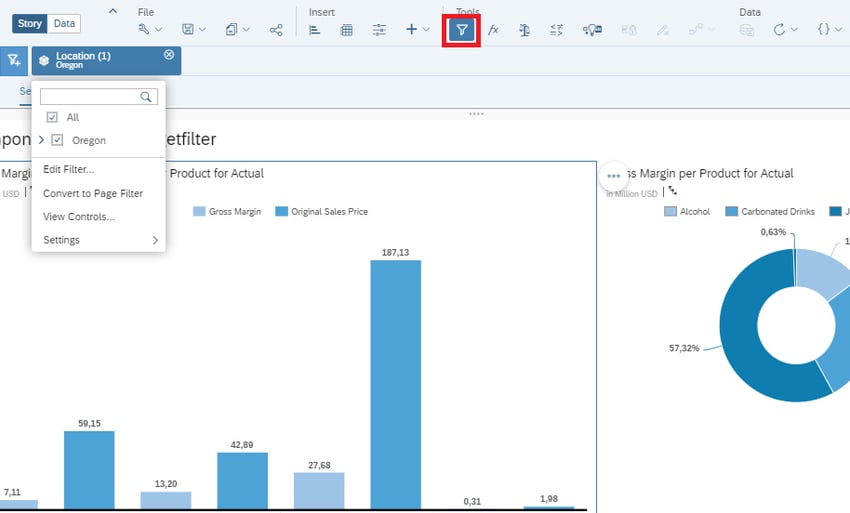
Page filter measure input control

Story filter

As the name suggests, a filter can be set for the entire dashboard with the Story filter. This filter also applies to all subpages of a story. Note that a story filter can only affect one model. In addition to characteristic values, key figure ranges can also be selected. In the menu, this filter is located in the "Tools" section and is represented by a funnel.

Story filter

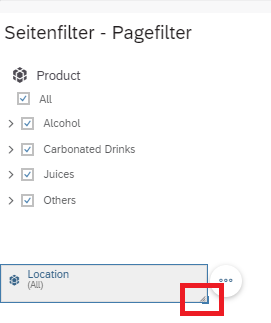
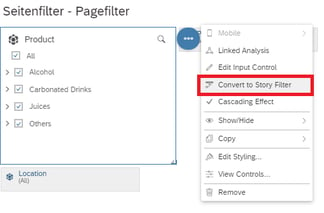
It is also possible to convert a page filter to a story filter (story filter to page filter as well). To do this, select the second icon from above in the context menu of the page filter. The story filter can be used, for example, if you want to filter according to a specific range or period of time.

Page filter convert to Story filter

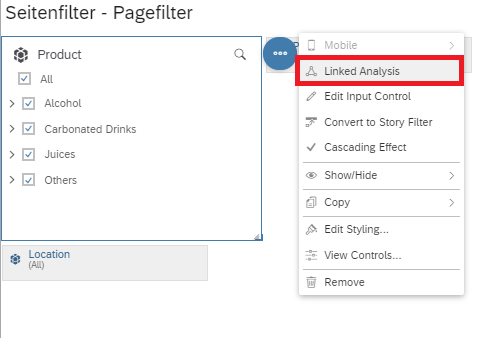
Alternative - Linked Analysis

Linked Analysis is not primarily a standalone filter. It is used to connect different widgets with a common model. 

Used with Page Filter

For example, it can be applied to the page filter to select the widgets to include.

Linked analysis

Used with charts

The linked analysis can also be used for charts. A click on "Carbonated Drinks" in the ring chart, for example, filters the linked bar chart.

Story filter

For charts there is a wider choice of settings:

  • Multiple / single widgets
  • Entire page
  • Entire Dashboard

For charts, however, user-friendliness should be taken into account. It is not immediately obvious to the user that the charts can be used for "filtering". This is especially true if a chart filters the entire dashboard. The user should be made aware of this at this point.

Learn all about SAC

,

avatar

Rafael

Rafael Sachs has been working as an SAP BW and BO consultant in various industries in Germany and abroad since 2013. He covers the range from requirements management to implementation. His core competencies are tailor-made solutions in the front-end area and the professional design of the company's own software NextTables. In his spare time he is a restless hiker, dog tamer and hobby cook.

Got a question about this blog?
Ask Rafael

Blog - NextLytics AG 

Welcome to our blog. In this section we regularly report on news and background information on topics such as SAP Business Intelligence (BI), SAP Dashboarding with Lumira Designer or SAP Analytics Cloud, Machine Learning with SAP BW, Data Science and Planning with SAP Business Planning and Consolidation (BPC), SAP Integrated Planning (IP) and SAC Planning and much more.

Subscribe to our newsletter

Related Posts

Recent Posts