/Logo%202023%20final%20dunkelgrau.png?width=221&height=97&name=Logo%202023%20final%20dunkelgrau.png)


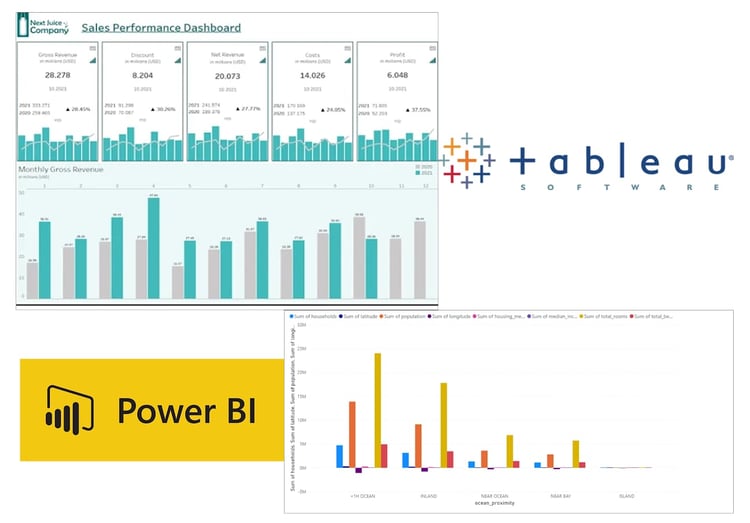
In the data-driven era, Tableau and Power BI have gained significant popularity as data visualization and analytics solutions. Both are known for their ability to transform raw data into meaningful insights and share many similar functionalities. In this article we will compare these two applications and uncover the similarities that underpin their success. Moreover, we highlight the differences that give each platform its unique identity.
A short introduction to Tableau
Tableau was founded in 2003 but the first release was in January 2005 making it one of the early players in the modern data visualization landscape. Tableau was acquired by Salesforce in 2019. Tableau offers flexible licensing options to cater to various user needs and organisation requirements. Tableau as a software is a data visualization and business intelligence tool that is built to provide the end users the ability to analyse and explore large or complex data. Also a Tableau user has the opportunity to create dashboards and a variety of visualizations, including bar charts, line charts, pie charts, maps, and many more, which help users to gain insights from data. Drag and drop functionalities in key areas, such as data preparation, visualization building, and customization, allow for an intuitive user experience. This user-friendly approach is particularly beneficial for users without programming skills, enabling them to create visualizations effortlessly.
Tableau can connect to various data sources, such as spreadsheets, databases, big data platforms and others. Once the data is loaded, many operations like data cleaning, transformation tasks and the creation of custom calculations are available, as well as the option to filter data and create hierarchies. Another feature is the real time data visualizations with the help of Tableau’s server component. Tableau GPT offers a suite of capabilities that bring trusted generative AI to accelerate the speed at which insights are generated while reducing repetitive tasks for data analysts through intelligent suggestions and in-app guidance.
A short introduction to Power BI
Power BI is a business analytics and data visualization platform by Microsoft that aims to fulfil the needs in business analytics and data visualization of the market. The user interface is structured in a simple way, which flattens the learning curve a lot. Also there is no need for programming skills in order to use it. Power BI offers multiple data shaping actions, including data transformation, data cleaning, and custom calculations. It provides a diverse range of visualization options, such as charts, pies, maps, and histograms, allowing users to present insights effectively. Power BI can effortlessly load data from other Microsoft programs as well as from all popular database management systems. It is known for its capabilities in data modelling and analytics.
Similarities
Tableau and Power BI are both popular data visualization tools used for business intelligence and data analytics. The applications offer a very user-friendly UI with the opportunity to use the drag and drop functionality and require no previous knowledge of any programming language in order to use them. If the user wants to perform advanced and specific custom calculations or conduct advanced analytics and predictive tasks, both Power BI and Tableau provide the opportunity for the user to do so via code. Additionally, code integration can assist users in working with the API provided by both tools, allowing them to programmatically interact with the tools and perform various tasks, such as data refresh and dashboard publishing.
Since Tableau and Power BI are visualization platforms, both of them allow users to create interactive and visually appealing data visualizations like charts, graphs, dashboards etc and it is also possible to create custom formulas and measures in order to perform various calculations. Also, both of them support connectivity to multiple data sources and are able to handle a wide range of data formats, databases, cloud services, and spreadsheets. Since both programs have a big community support, it is quite easy to find tutorials, resources, forums and solutions for problems that may arise. Both of them allow users to analyse and monitor up to date data since they offer tools for real time data processing.
Self-Service Analytics with Tableau -
Download the whitepaper here!

Differences
Both Tableau and Power BI offer an on prem version and both of them offer a cloud based solution too. The Licensing options for both are role based or server based and in some scenarios even a combination of both. Both employ distinct pricing models, which can significantly impact overall costs and you need to pay attention to the details (see box below).
A big advantage of Power BI is that it is easily integrated with all the Microsoft solutions like Excel, SharePoint, Azure, and SQL Server. This means that Power BI seems to be a better solution for companies that have already invested in the Microsoft ecosystem. On the other hand, a big advantage of Tableau is that it is better in processing large volumes of data, or data that is characterised by complexity.
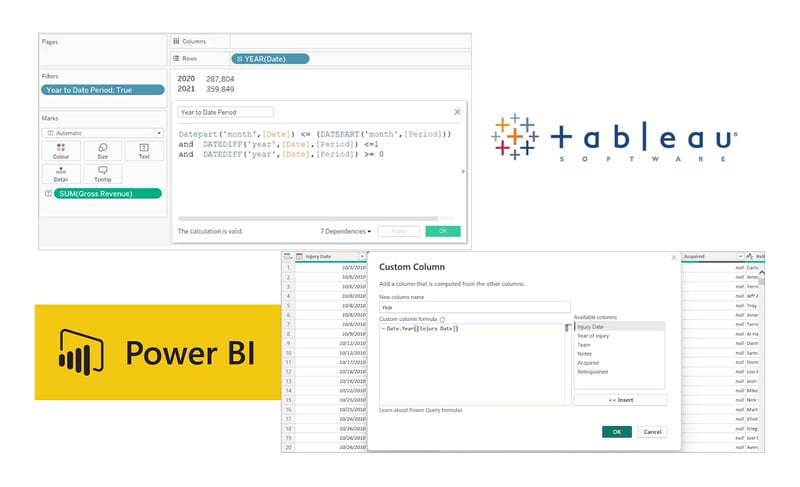
When it comes to data preparation, Power BI offers Power Query which is not a standalone tool as it is integrated with Excel and Power BI. This tool also allows users to clean, transform, and reshape data before visualising it. The same work can be done in Tableau with the usage of Tableau Prep but Power Query Editor is considered to be better. Both of them, Power Query Editor and Tableau Prep, enable users to perform various data preparation tasks, such as data cleaning, joining, pivoting, aggregating, and creating calculated fields. When comparing the learning curve of both applications, it seems to be a bit smoother for Power BI due to its integration with other Microsoft programs. Last but not least, the factor of OS compatibility is an issue for Power BI since it is designed and developed for Windows. This is not an issue for Tableau which is a program that can run on Windows and Mac OS as well. A web based version of Power BI called Power BI Service is also available and of course it’s running on any OS. Also, Power BI is closely integrated with Azure as part of the broader suite of Azure solutions.
|
Power BI |
Tableau |
|
|
Cost for role based Licence |
Power BI Desktop : Free Power BI Free : Free to view reports (only available for Premium capacity or on prem server) Power BI Pro : 10$ per user/month Power BI Premium per user: 20$ per user/month Power BI Premium per capacity (dedicated Server): 4,995$ per capacity/month Remark: If you don’t have a Premium Capacity or on Prem server all users need to have Pro license weven if they only should / want to view a report |
Tableau Creator: 70$ per user/month Tableau Explorer: 42$ per user/month Tableau Viewer : 15$ per user/month |
|
On Prem Server |
Similar cost involved than Power BI Premium per capacity |
Role Based licensing and per core licensing available Remark: If you need to run an on prem server and only have a few users (role based) then tableau can be a lot cheaper option as no server licence is needed |
|
Performance |
It is fast when it comes to not that big amount of data. The performance on bulk data is slow. |
It is fast when handling large volumes of data, and also has a lot of features for visualising the data. |
|
Programming Support |
Power BI supports integration with R, Python and with Power Query M language, which is a functional case-sensitive language that allows you to perform data shaping tasks and create custom functions. The Language DAX is supported to define logic at runtime of report, e.g. Key figures and restrictions. |
Tableau provides a very good integration of code with the following languages : Python, R, C, C++ and Java. |
|
Data sources |
Power BI supports various data sources like
|
Tableau supports numerous data sources such as
|
|
Machine learning |
Power BI allows you to build machine learning models and make predictions. The training of the models can be done in Power Query Editor. Also, in Power BI, the Automated Machine Learning feature can be used. Furthermore Power BI benefits from Microsoft's suite of business analytics solutions, which encompasses platforms like Azure. |
Tableau doesn't have built-in native machine learning capabilities like Power BI's AutoML feature but supports the feature of Python machine learning and thus the users have the ability to perform any machine learning operation over the datasets. |
|
Toolset |
Power BI offers a comprehensive set of tools and features, but achieving certain solutions within Power BI it is not as readily accessible |
Tableau provides a wide range of tools and features that encompass various data analysis, visualization, and reporting needs. |
|
Community |
There is the relatively new Power BI |
A documentation site is available where the users can find information and instructions about Tableau. Also, as a program that is in use for more years than Power BI ,it has an even larger community. Furthermore, Tableau has the Tableau User Groups that are groups of users where regular meetings happen with guest speakers and the goals of these groups are to share knowledge with webinars where members can network, learn from guest speakers, share best practices and use cases. |
Data Visualization Tools - Our Conclusion
Both Power BI and Tableau are powerful data visualization and business intelligence applications. Power BI stands out as an excellent option for organisations using Microsoft technologies due to its seamless integration with the Microsoft ecosystem. Its user-friendly interface and extensive data transformation capabilities further solidify its position as a top choice in this category.
On the other hand, Tableau's strength lies in its robust data discovery and interactive visualizations, making it an excellent solution for data analysts and scientists seeking advanced analytics capabilities. Tableau is also known for being a more premium offering with better dashboarding tools and greater scalability, albeit at a premium price. Both tools have their unique characteristics and the choice of which one should be chosen to work with is dependenting on the requirements and the existing technology ecosystem. Also, there are a couple of more options in the data visualization and business intelligence field, like Apache Superset and SAP Analytics Cloud (SAC). A comparison of those will be published in a new article.
Do you have questions about the features adressed in this article or other topics? Contact us! As a Tableau partner, we are happy to advise you extensively on topics such as best practices for creating effective dashboards.