At the end of the year, Tableau is once again adding some exciting and promising features to its products. We have taken a close look at the new Tableau Release 2021.4 and the features praised by Tableau. Read our article and find out what possibilities an update to the new version offers you and why we still have mixed feelings about the new release despite the many new features.
The most important improvements at a glance:
- Virtual connections and central definition of row level security
- Copy and paste function in dashboards
- Parameters and tiling in Tableau Prep Builder
- Embedding metrics
- Improved Slack integration
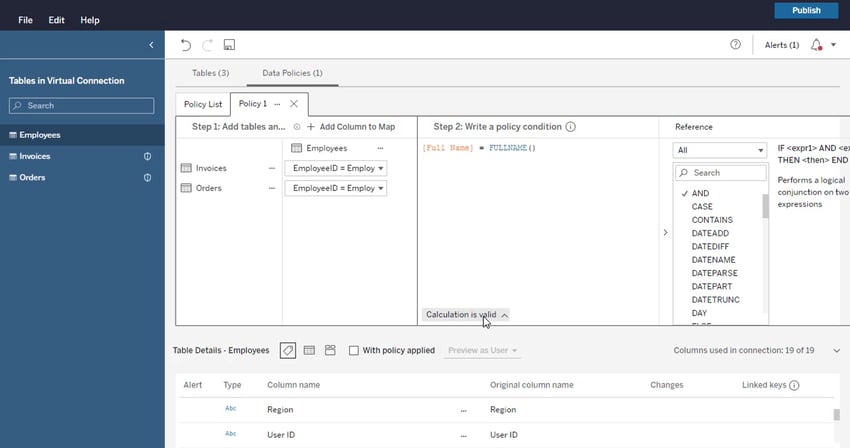
Central management of data connections
With Virtual Connections, Tableau is adding a new content type to the Data Management Add-On that allows users to centrally manage all data connections. Instead of creating the same connection separately for each Tableau data source as before, users with the proper permissions can create their data sources based on a virtual connection to the source system. As a central access point, virtual connections bring a number of advantages. For example, outdated connection information no longer needs to be updated separately for each data source, but can be adjusted centrally. Changes to the virtual connection are then applied to all downstream elements.
Data policies simplify the definition of row-level security
Virtual connections ensure a single point of access. For this reason, they are ideal for centrally defining which user is allowed to see which data. Tableau has also recognised this and introduced data policies. Data policies include filter conditions that are applied when data is queried during analysis. Once defined, the data policy is taken into account by all downstream data sources. The new feature thus makes it obsolete to apply the appropriate filters at workbook or data source level and greatly simplifies the management of row-level security.
Copy and paste selected components
The next feature we present has gone viral within the Tableau community after it has been leaked. Release 2021.4 delivers one of the most anticipated features among Tableau users: A copy and paste feature for the elements within a Tableau dashboard.
Users already could duplicate individual worksheets or dashboard pages. The feature to copy-paste individual dashboard components such as containers or buttons has remained elusive for a long time, despite much demand in the community.
For this reason, the announcement of such a feature with the new 2021.4 release caused quite a stir within the Tableau community. Finally, one would be able to copy entire dashboard sections composed of different components between different dashboards without having to replicate them in tedious detail work. But we rejoiced too soon! At the moment, the copy function is essentially limited to images, buttons, text elements and, to a limited extent, containers. Charts and tables, as well as containers containing them, cannot be copied. Users must initially be satisfied with copying the container framework as an empty template and manually filling it with content. Those components that can be copied, however, can not only be copied within a workbook, but also between different workbooks and across applications.
In our test, however, we experienced a couple surprises. For example, the size of the copied elements changes when you copy them from one dashboard to another. All in all, the feature is a good start, but there is still a lot of room for improvement.
Self-Service Analytics with Tableau - Download the whitepaper now!

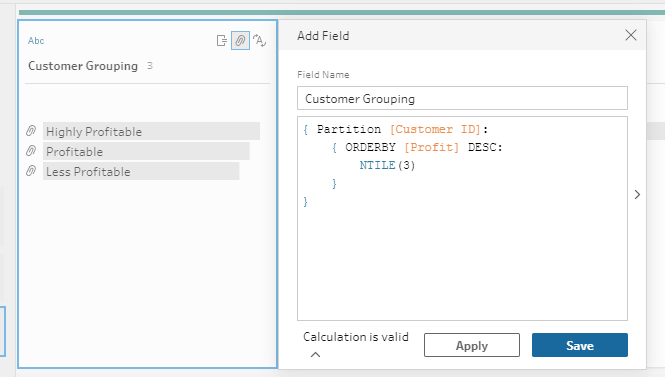
New features in Tableau Prep Builder
Tableau Prep Builder has also been provided with new functions as a result of the update. Users can now create parameters and use them throughout the workflow. Tableau parameters can be used to implement dynamic filters, for example. Similarly, different extracts can be created in no time at all to look at different scenarios. Parameters can even be referenced in the output step in the name or location of the output.
In addition to parameters, users can also use the new Tile function in the calculation editor. Using tiles, the entire data set can be divided into any number of groups based on a user-defined order. The Tile function is particularly useful for making comparisons between different groups. For example, customers can be grouped by total sales without having to specify specific sales thresholds.
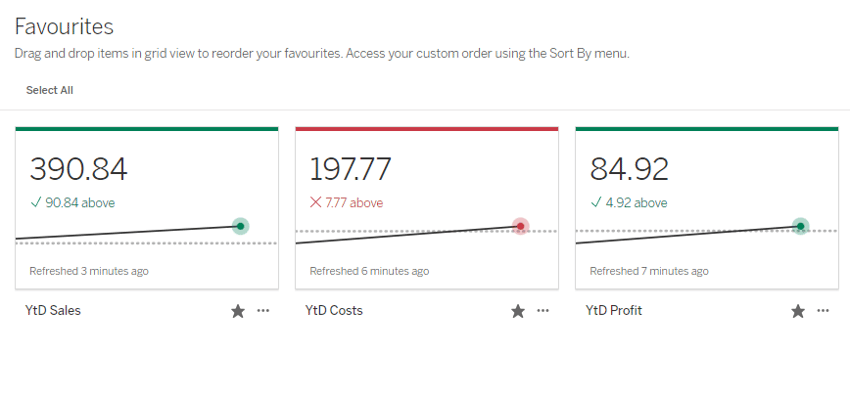
Keep better track of your KPIs with metrics
In early 2020, Tableau introduced metrics to allow users to get information about key KPIs and their trends without having to open the respective dashboards. However, to gain insight into key KPIs outside of Tableau, it was still necessary to embed full dashboards in external applications or the enterprise portal. The new release remedies this. With Tableau 2021.4, metrics can be flexibly embedded in external applications. In addition, new functions are available to users when creating metrics. Among other things, it is now possible to specify the date range for which the development of the metric is to be displayed and to show an indicator for the development.
In addition to the features mentioned, there are a number of other improvements within the scope of the new update. For example, data sources that have already been published can now easily be edited in the web environment instead of having to download them in order to republish them after editing. In addition, Tableau is very keen to expand the integration with the collaboration tool Slack, which was introduced this year. Tableau has also improved its mapping functionalities. With the latest release, you are no longer limited to a single data source when analyzing data with a map. Using different map layers, you can now use data from different data sources when analyzing in a single map
Our take on Tableau 2021.4
With the last update in 2021, Tableau fulfilled some customer wishes before Christmas and introduced some long-awaited features. Unfortunately, however, some of these features remain reserved only for those customers who have licensed the Data Management Add-On. Due to its capability to define and manage row level security from a central point, there is probably no way around licensing the Add-On for some customers in the future if they want to contain the overhead of managing data sources and guarantee consistent security concepts. The limitations of the copy-paste function have also put a big damper on the entire Tableau community. Despite all this, the 2021.4 release undoubtedly includes the most extensive improvements in 2021, and Tableau has shown that the wishes of the community are being heard. The past update fuels our hopes that exciting features also await us next year and that the shortcomings identified will be addressed in future releases.
Do you have specific questions about the new Tableau release? Feel free to contact us and request a non-binding consultation offer.