/Logo%202023%20final%20dunkelgrau.png?width=221&height=97&name=Logo%202023%20final%20dunkelgrau.png)


SAP Datasphere offers several ways to prepare data. For example, you can use views to combine local or remote tables and other views. This allows you to link, filter and enrich data. In addition, you can rename or remove columns and add calculations.
In SAP Datasphere you can create graphical views and SQL views. Which approach is right for you? In this article, we compare the two options to help you make an informed decision based on your specific business needs.
Understanding Graphical Views
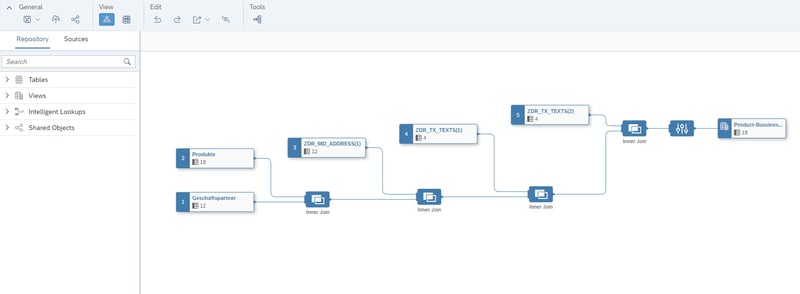
Graphical views allow you to prepare your data even without SQL knowledge. With the help of a graphical interface, even non-technical and business users can create views. You can add and combine different sources via drag & drop.
You can also refine, filter and enrich data. In the graphical editor it is possible to add data sources, create joins and unions, rearrange, rename or exclude columns. Moreover, you can create new calculated columns, filter and aggregate data. Therefore, graphical views can be used to simplify data flows.
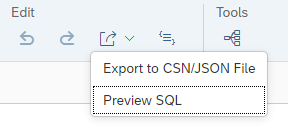
If necessary, you can generate and display the corresponding SQL statement via the menu path Edit → Export → Preview SQL. This way, graphical views can be used as a template for the SQL views.
Understanding SQL Views
With SQL views you can cover complex scenarios where graphical views reach their limits. Graphical views are limited to SQL statements, the functions of SQLScript are not available. In SQL views, on the other hand, you can use both languages.
But even relatively simple views look tidier in SQL. Provided that you follow our tips on readable SQLScript. An experienced developer will then understand at a glance what is happening within the view. Without having to click through the individual joins in the graphical editor. This can speed up maintenance.
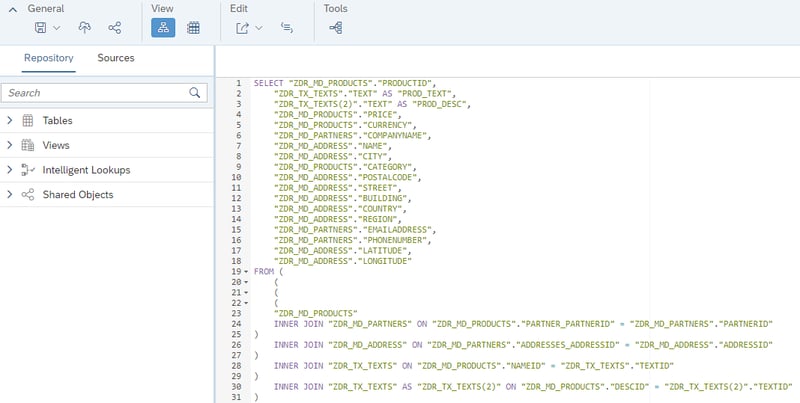
SQL views are written in an SQL editor. The tables or views to be used can be added by drag and drop and are transformed into code. In addition, automatic suggestions and auto-completion support the developer.
Download the whitepaper and find out
which product is best for your data warehousing strategy
When creating SQL views, you can use either standard SQL or SQLScript as language. With SQL, all the logic has to be done in a single SELECT statement, which can become confusing very quickly. On the other hand, using regular SQL allows Datasphere to recognize the structure of the result of the query automatically and populate the fields with semantic information from underlying objects (e.g. measures, attributes, semantic types, data types, etc.)
You can also use SQLScript to define internal tables to be used in the code. In addition, you can make use of window functions to implement even complex requirements. So, the SQL Views give you more flexibility.
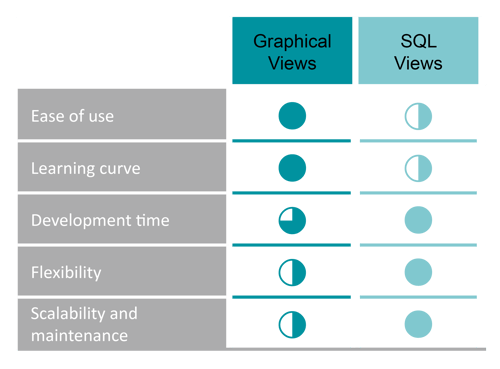
Key differences between graphical and SQL Views
So what are the main differences between the two approaches? While graphical views offer an easy-to-use, user-friendly interface, SQL views score high on flexibility. Thanks to their visual representation, graphical views do not require technical skills. In addition, graphical views are less error-prone.
SQL Views are more suitable for an experienced developer. The developer has the possibility to fulfill even the most complicated requirements. For example, using SQLScript subqueries and window functions (e.g. ROW_NUMBER() OVER ( PARTITION BY)) can be defined.
In addition, a tech-savvy user will write the SQL code faster than defining the joins via drag and drop. Furthermore, the SQL views are easier to maintain. The logic can be grasped at a glance. One does not have to go through the individual joins to understand the links between different tables. The code used in one query can also be applied to other queries with just a few adjustments.
Use cases and Best Practices
If you compare the two images below, you will notice that the SQL code is much easier to read. Therefore, for views that will grow and have to be adapted over time, you should rather use SQL views. If you are currently using graphical views for these scenarios, you should consider migrating. The sooner you make the move, the easier it will be. It is true that graphical views can be exported to SQL code, as mentioned above. However, this machine-generated code is difficult to read and needs to be adapted for human users anyway.
If you decide to use SQL Views, consider our tips for readable SQLScript code and tips for SQLScript performance as best practices. You will see the benefits when it comes to subsequent maintenance.
SQL or Graphical Views - Our Conclusion
Ultimately, it depends on your individual case when to use which view. When making a decision, you should consider the project goals and capabilities of the team as well as the complexity of the data and long-term scalability. If you are expecting large complexity of a business logic, mostly for your major transactional data models, then it is a good idea to start right away with SQL as converting the Graphical View to SQL will produce a barely readable version of SQL that will lead to a lot of manual adjustments afterwards.
Where applicable, a mixed scenario is also an option. You can use graphical views in your SQL logic or enrich functions written in SQLScript in the graphical interface.
Do you have questions about SQLScript or SAP Datasphere? Do you want to convert your transformation routines to SQLScript and are looking for experienced developers with SQLScript know-how? Please do not hesitate to contact us.