In the age that data is the lifeblood of the organizations, choosing the ideal data visualization tool is a crucial task. Apache Superset and SAP Analytics Cloud (SAC) are two prominent contenders, each offering unique features for data exploration and visualization. In this article we provide an extensive comparison of these two tools and present all those characteristics that are critical to help you choose the data visualization tool your organization needs.
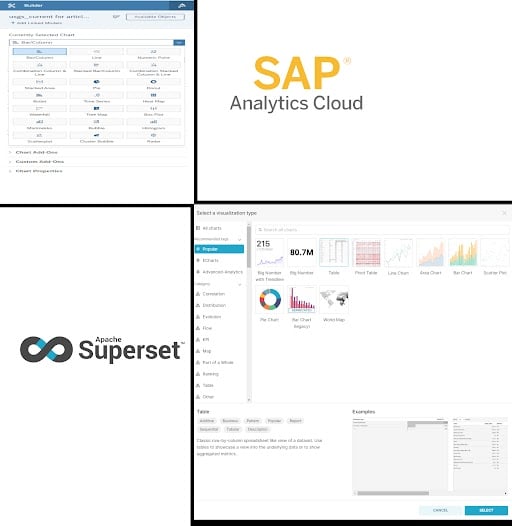
A short introduction to Apache Superset
Apache Superset's first release, under the name "Superset," was back in 2016. It was initially developed by Airbnb as an internal tool for data visualization and exploration. Later, Airbnb open-sourced the project and donated it to the Apache Software Foundation, where it became an Apache Top-Level Project known as "Apache Superset." Since its initial release, Superset has gained popularity as an open-source data visualization platform and has continued to evolve with contributions from the community. The platform's ecosystem has expanded with the development of numerous plugins and connectors. Apache Superset has been adopted by organizations of various sizes and industries for building interactive and shareable dashboards. It excels in managing large datasets, ensures data security with state-of-the-art authentication methods, and empowers users with role-based access control. Notably, it also supports real-time data exploration, making it an indispensable asset for data professionals seeking dynamic insights.
A short introduction to SAP Analytics Cloud (SAC)
SAP Analytics Cloud (SAC) appeared earlier in the market (2012) than Αpache Superset and its arrival marked the beginning of cloud service offerings by SAP for analytics initiatives. It is a software as a service (SaaS) business intelligence (BI) platform. SAP Analytics Cloud is known as a powerful platform that helps businesses analyze their data and share insights. SAP Analytics Cloud is tightly integrated with SAP HANA Cloud Platform (HCP), offering a unified, cloud-based ecosystem for data analysts and business decision-makers. This versatile tool empowers users to effortlessly visualize data, conduct planning activities, and harness predictive capabilities, all within a secure and user-friendly cloud environment. It provides a browser-based UI for creating interactive dashboards, reports, and data visualizations, making it accessible to both technical and non-technical users. SAC connects to various data sources, from databases to cloud services, allowing you to work with your data in one place. Last but not least, users have the option to integrate ETL processes, if they use SAC models as databases, to prepare and optimize their data for analysis, offering a flexible approach to data preparation.
Similarities
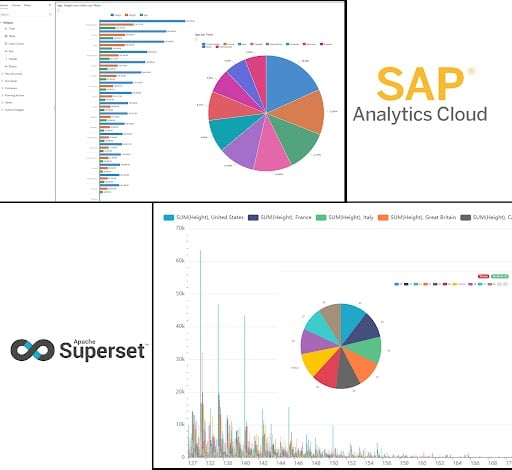
Apache Superset and SAP Analytics Cloud, share some similarities. Both tools allow users to create graphs, charts and dashboards as both tools are known for their data visualization capabilities. Another reason that both tools are popular is that both tools provide a user-friendly interface. Users with less technical background are able to use them. Furthermore, the option to change the layout, apply themes and define custom styles is also provided. Additionally, another characteristic of Superset and SAC is that both tools support collaboration features, thus multiple users can work on and share dashboards. It should be noted that it is not possible to work on the same dashboard at the same time. In both of these tools, users can explore their data through SQL queries. Additionally, SAC provides intuitive drag-and-drop interfaces, accommodating both technical and non-technical users.
Moreover, SAC and Superset support connectivity to a variety of data sources, including relational databases, cloud-based data warehouses, and other data repositories. Knowing that security is a big aspect for a data visualization tool, SAC and Superset offer some security features, such as role-based access control (RBAC) to control who can access and modify data and dashboards. Mobile access is also offered in both of the tools allowing users to view and interact with dashboards and reports on mobile devices. Both platforms support extensibility to some extent. While the open source Python project Superset is more customizable with plugins and connectors, SAC offers integration with other SAP products and extensions. Last but not least, Superset and SAC give the ability to interact with the tool’s artifacts with API.
Dashboarding with SAP Analytics Cloud -
Download the whitepaper here!

Differences
The first and maybe the main and most easily notable difference between SAC and Superset is that SAC is a commercial product developed and supported by SAP, a global software company while Superset is an open-source project under the Apache Software Foundation. Apache Superset is known for its high level of customization and extensibility. Users and developers can create custom visualizations, plugins, and connectors. On the other hand, SAC offers customization options but is less flexible in terms of adding custom functionality compared to an open-source tool like Superset. Additionally, SAC is developed and maintained by SAP as a commercial product with a focus on enterprise requirements while Apache Superset benefits from an active open-source community, with contributions from a wide range of developers and users. Besides that, while Superset offers a state of the art SQL IDE for preparing data for visualization, SAC offers a guided drag and drop interface for data preparation and visualization and it does not provide a built-in SQL editor writing custom SQL queries like Apache Superset.
SAC provides a tool named “generative AI”, and it is a form of artificial intelligence that can produce text, images, and varied content based on the data it is trained on. Also, in SAC the ability to build a machine learning model and train it is offered using pre-built machine learning models and algorithms for predictive analytics. These models cover a wide range of use cases and help users to explore data more deeply and simplify the adoption of machine learning for business intelligence and planning purposes.
|
SAP Analytics Cloud (SAC) |
Apache Superset |
|
|
Cost and licensing |
SAP Analytics Cloud offers flexible licensing options and subscription-based plans. There is also a 30-day free trial Business Intelligence: Starts at $36 per user per month (for the first 20 users) Planning: please contact SAP directly for a custom quote |
Open-source, no licensing costs The operational cost of Apache Superset can depend on a couple of factors, the most important is the infrastructure cost. It needs servers or cloud resources to host it as well as expert knowledge and support from a service provider like NextLytics, if these cannot be provided internally. |
|
Data sources |
SAC supports numerous data sources such as :
|
Superset supports various data sources like:
|
|
Target group |
Targets companies and organizations looking for a comprehensive business intelligence solution without having to worry about the technical details and customizability. It is often a choice for companies with SAP systems, as it integrates seamlessly with these environments |
Is primarily targeted at developers and data-oriented users who want full control of their business intelligence solution and are willing to do the development and configuration required. While visualizations and dashboards are created with a modern drag-and-drop user interface, proficiency in SQL is required for any data preparation and modeling steps. |
|
Alerting and Reporting |
Limited alerting and reporting features |
Superset offers SQL-query based email alerts, scheduled email reporting, and the capability to include screenshots in the reports |
|
Performance |
SAP Analytics Cloud combining efficiency and scalability, allowing users of all skill levels to effortlessly analyze and visualize their data |
Apache Superset is fast, lightweight, intuitive, scalable and loaded with options that make it easy for users of all skill sets to explore and visualize their data |
|
Machine learning |
SAC offers also Machine learning capabilities with the use of the following tools :
|
Apache Superset does not have a build in functionality for machine learning, but since it is easily integrated with python, the user can operate any machine learning model using python libraries |
|
Community |
As a powerful business intelligence and analytics solution, SAC offers a range of resources to support its users. SAC provides a documentation site that provides the users with instructions and information. Furthermore, the fast-expanding SAC community can be found on platforms such as SAP Community, SAP Community Answers, and dedicated SAP forums. |
As an open-source program, Apache Superset boasts a thriving community of users and contributors. With an ever-expanding user base, Superset provides a dedicated documentation site that offers comprehensive instructions and valuable information for both beginners and experienced users. Additionally, the fast-growing community can be easily accessed on platforms such as GitHub, Slack, and Stack Overflow. These channels foster collaboration, provide support, and facilitate collaboration among the users |
|
Programming Support |
SAP Analytics Cloud offers flexible programming support, allowing users to extend its functionality and customize their analytics experience. SAC supports:
|
Apache Superset empowers users to customize and extend the platform to suit their needs. Superset supports:
Finally, Apache Superset is fully REST-API based - any task available through user interfaces can be automated through remote commands. |
Data Visualization Tools - Our Conclusion
SAC stands out for its robust enterprise-level capabilities, offering a seamless integration within the SAP ecosystem. Its strength lies in its ability to provide comprehensive solutions for organizations seeking to make data-driven decisions on a large scale. On the other hand, Apache Superset shines in its open-source flexibility and extensibility and caters to a SQL-proficient audience of data analysts. The open-source nature of Apache Superset allows for limitless possibilities and customization options, ensuring it caters to your unique data visualization requirements. The lack of licensing costs make it a great alternative for large-scale or public reporting.
As you embark on your data visualization journey, remember that the choice between these two platforms depends on your unique needs and goals. And Nextlytics can help you navigate this decision-making process. We will be happy to help you. Request a non-binding consulting offer today.