Despite the ongoing Corona pandemic, SAP has once again launched numerous innovations for the SAP Analytics Cloud (SAC) this year. In addition to smaller changes, such as the new permission management for comments, additional task types for more extensive planning scenarios and the possibility to use Search to Insight via Voice Interaction, there have also been some larger changes and enhancements, which we would like to present in the following blog post.
Enhanced layout options for Canvas Pages
The second and latest quarterly update to SAP Analytics Cloud brings a number of new layout options that go a long way toward creating pixel-perfect reports. Thanks to the new automatic sizing and pagination feature, tables can now be enlarged or reduced to fit the content and split across multiple subpages instead of having a scrollbar. It is then possible to switch between the individual sub-pages of the table using a button on the respective Canvas Page.
The new relative positioning feature also ensures that the visibility of widgets is not affected by the expansion of individual table rows. In this case, charts below will no longer be covered by the table , but moved down accordingly.
Sections introduce a new element to the story interface that allows story creators to replicate selected widgets for all elements of a specified dimension instead of having to create them manually. This duplicates all charts and tables associated with the section for each dimension element and filters each duplicate to a single element. Alternatively, you can navigate between different section pages, creating a separate page for each Dimension Element.
Story Exploration
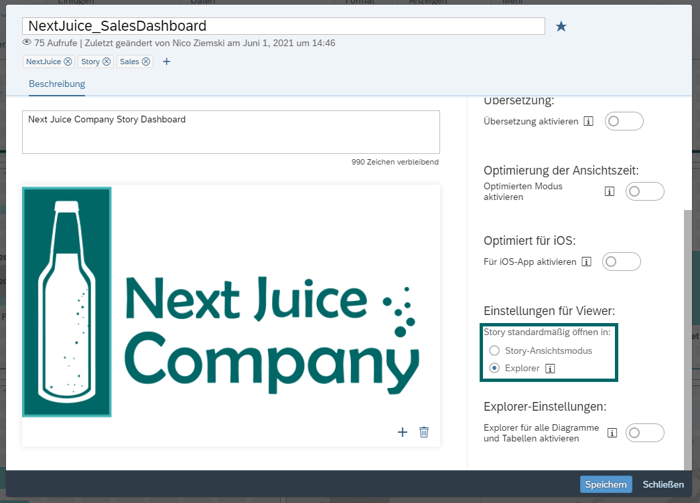
Explorer Mode has previously allowed viewers to make changes to selected charts in the story to gain new insights from the data. When Explorer mode is enabled for a widget, users can swap out dimensions and metrics, change the chart type, and adjust the sort order, among other things. Instead of enabling Explorer mode for specific widgets, story creators can now enable it across the entire story, overwriting existing widget-level settings. Similarly, it is now possible to open the story directly in Explorer Mode instead of switching to the Explorer view via the usual Viewer Mode. Here, viewers can then choose between all the pages of the story and the charts and tables they contain and make the desired adjustments. Finally, the Explorer Views can be saved and inserted into existing or new Story pages.
Dashboarding with SAP Analytics Cloud -
Download the whitepaper here!

New data model
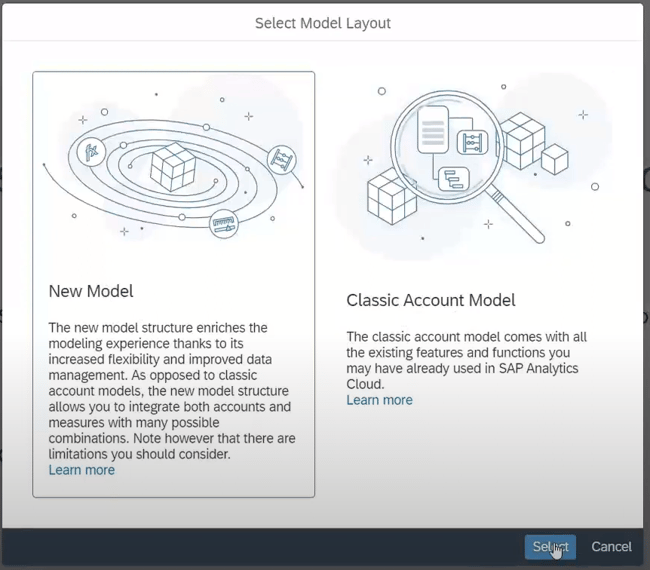
Another innovation in the SAP Analytics Cloud this year was the introduction of a new data model that extends the structure of the account model and allows for more flexibility in modeling. While the classic account model consists of a single measure and account dimension, measures can be added as independent entities in the new model.
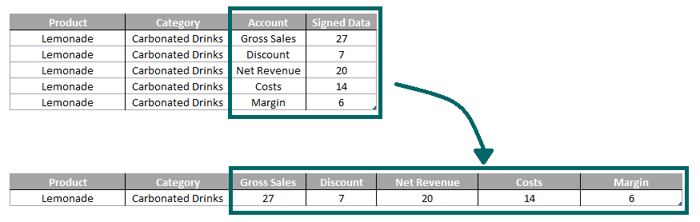
With the new release of SAC, it is thus possible to create both pure key figure models and hybrid scenarios with multiple account dimensions and key figures. Existing account models will continue to be supported, but can be converted to new models if needed. However, before converting your old models, we recommend that you duplicate them. During migration, the old model will be deleted and Stories based on that model will need to be adjusted accordingly.
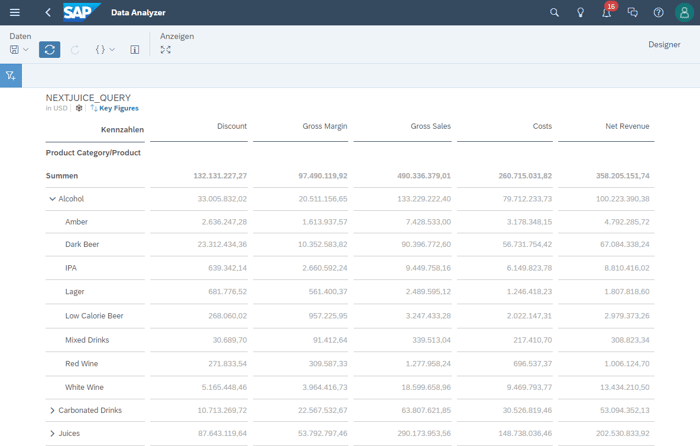
Data Analyzer
With Data Analyzer, users can connect live to SAP BW queries and SAP HANA Calculation Views directly from SAP Analytics Cloud without having to create a Story or model first. The Data Analyzer builder panel can then be used to add or remove any dimensions and metrics from the table, apply filters, and change the sort order to gain insight into the data. Starting with the first quarterly release this year, users can now save these insights and share them with the desired group of users, instead of having to apply the same formatting each time they access data through Data Analyzer to replicate the result.
Enhancement of the Smart Discovery feature
Using the Smart Discovery feature of SAP Analytics Cloud, entire Stories can be created with just a few mouse clicks. After selecting the data model, one sets a metric contained in it as the target and makes a selection of dimensions to further define the scope of the analysis and the aggregation level. At this point, SAP has extended the feature with an optional step to check the data to be analyzed. After running Smart Discovery, you get a complete story that analyzes the selected metric in different contexts. Stories created in this way are still very expandable, but often already provide a good basis for further analysis, as all charts and tables can be adjusted as desired and then be saved.
Voice to Insight
For some time now, it has been possible on mobile devices to address questions in natural question to the SAP Analytics Cloud. While these questions previously had to be formulated in writing in a designated field, the Q1 release this year has now made it possible to address these questions to SAC via voice interaction. Search to Insight then selects an appropriate data model and creates a corresponding chart to answer the question. If the question has not been answered sufficiently or was based on the wrong data model, users can make the necessary adjustments by manually modifying the question or data model. Search to Insight is fully integrated with the Story environment, so charts created in this way can be transferred directly into the Story.
SAP Analytics Cloud Release - Our Conclusion
Over the year, there have been some exciting and promising innovations for the SAP Analytics Cloud. However, some wishes still remain open. For example, the enhancements to the layout options are so far only available on graphic pages.
Especially the newly introduced section elements would be a good addition to common filters on flexible pages and would enhance the user experience of responsive dashboards. Likewise, there is still room for improvement in the migration of account models to the new data model. At the moment, this is still associated with additional manual effort, which could be remedied in future releases. Nevertheless, SAP shows here that the company is striving for constant improvements, even in times of crisis, and is already giving a good preview of what innovations we can expect in the future.