/Logo%202023%20final%20dunkelgrau.png?width=221&height=97&name=Logo%202023%20final%20dunkelgrau.png)


With the new update of SAP Analytics Cloud, the long-awaited possibility to debug advanced formulas has finally arrived. The developer can set so-called tracepoints in order to check the results after executing the data action. The insights gained from this help to improve the data action and fix potential problems.
However, there are some peculiarities that you, as an experienced developer, should take into account. For example, unlike debugging in FOX or ABAP, the execution of the data action is not stopped. Rather, you can analyze the changes ex post. Also, no data is physically changed. Instead, a dedicated tracing version is used.
In this article, we go into detail about tracing in advanced formulas. You will learn how to set tracepoints, what to consider when debugging loops and how to analyze the tracing results.
How to set tracepoints
As mentioned earlier, debugging in SAP Analytics Cloud (SAC) is performed based on trace points. After executing the data action in trace mode, you can check the data changes between each tracepoint and draw conclusions about the behavior of your code.
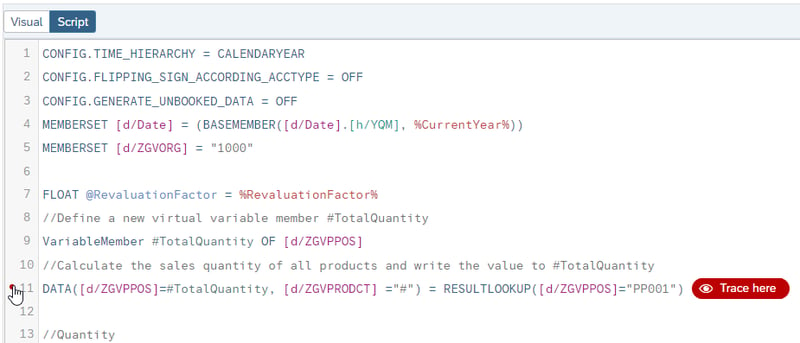
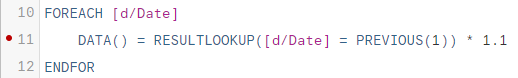
To create a tracepoint, click on the left margin next to the line number in your script. The red indicator (Trace here) appears and then disappears shortly after. When you move your mouse over the trace point, it becomes visible again. As you can see on the screenshot, the indicator appears at the end of the line. This indicates that you will see the results after the execution of this command line.
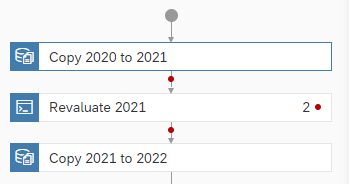
You can also define tracepoints before or after each step. To do this, click the connection arrow between the steps in the left-hand area of the data action.
To remove a tracepoint, you can simply click on it again. Alternatively, you can use the tracing area. When you move the mouse over a trace point, the X icon appears to delete the tracepoint.
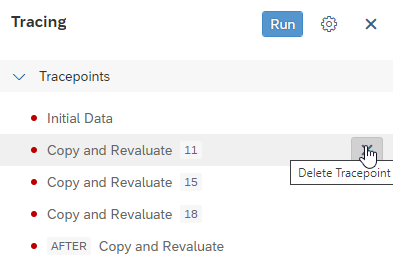
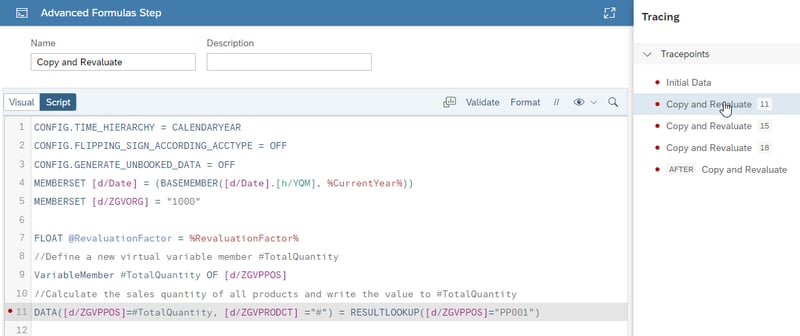
You can also use the trace area to jump between tracepoints in the code. When you click on a tracepoint, the respective code line in the script is selected.
Please also note the following restrictions. Tracepoints cannot be set in the graphical editor. This is only possible in the script view. In addition, you can set a maximum of 20 tracepoints. However, this number should be sufficient for most scripts.
Debugging of loops
If you use loop instructions such as FOREACH, FOREACH.BOOKED or FOR in your advanced formula and want to debug them, the debugging approach is slightly different.
In order to debug such commands, you have to define so-called conditional tracepoints. You can define a maximum of 10 tracepoints.
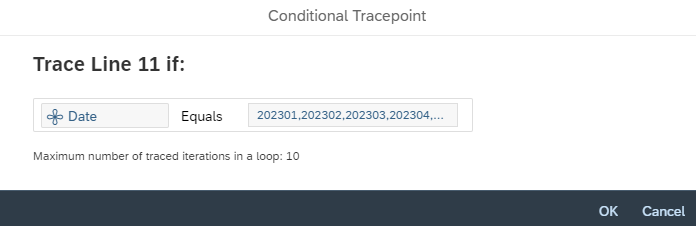
When the trace is executed, the results are available for selected iterations only.
In the next section, I explain how you can view and analyze the results.
Analyze tracing results
After you have set the desired tracepoints, you can execute the trace to check the results. To do so, switch to the tracing view.
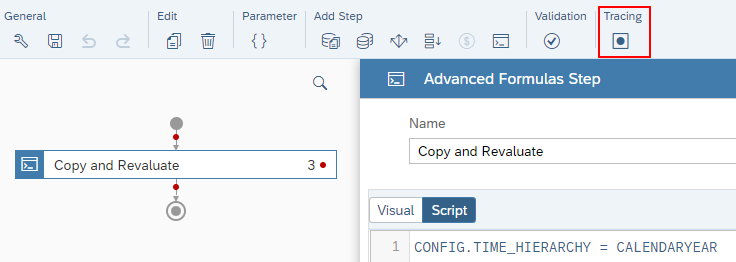
Here you can check the set trace points again and start the trace.
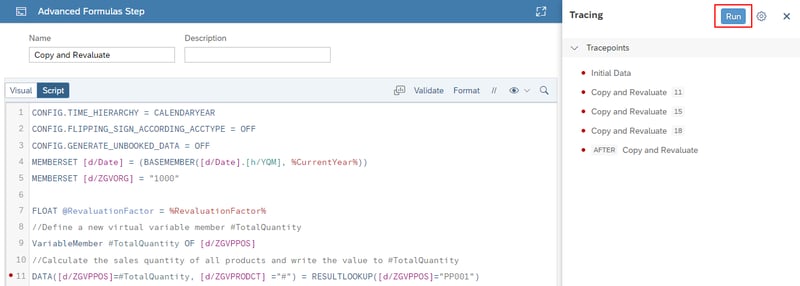
After you set the parameters for your variables in the prompt, the data action is executed in trace mode. Note that this does not change the target version you selected. Instead, the system creates a dedicated tracing version that contains all changes.
SAP Planning tools compared - SAP BW IP vs. BPC vs. SAC
You can view the results in the Watch Area. Under Parameters, you can see the parameter values valid for execution. This includes the parameters set in the data action settings as well as the values selected in the prompt.
Under Variables you can see the values of number variables of the type "Float" or "Integer". This includes, for example, the revaluation factor.
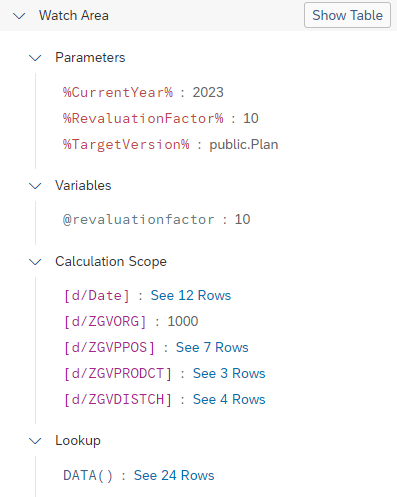
Under Calculation scope you can view the exact scope of the calculation based on dimensions. If only one element of the dimension is affected, only its ID is displayed. If there are several elements for a dimension, their number is displayed. By clicking on the number, you can view a list of the used elements.
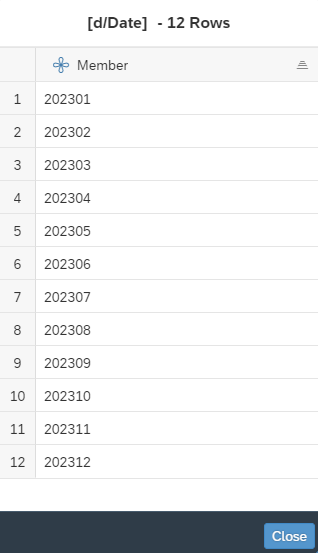
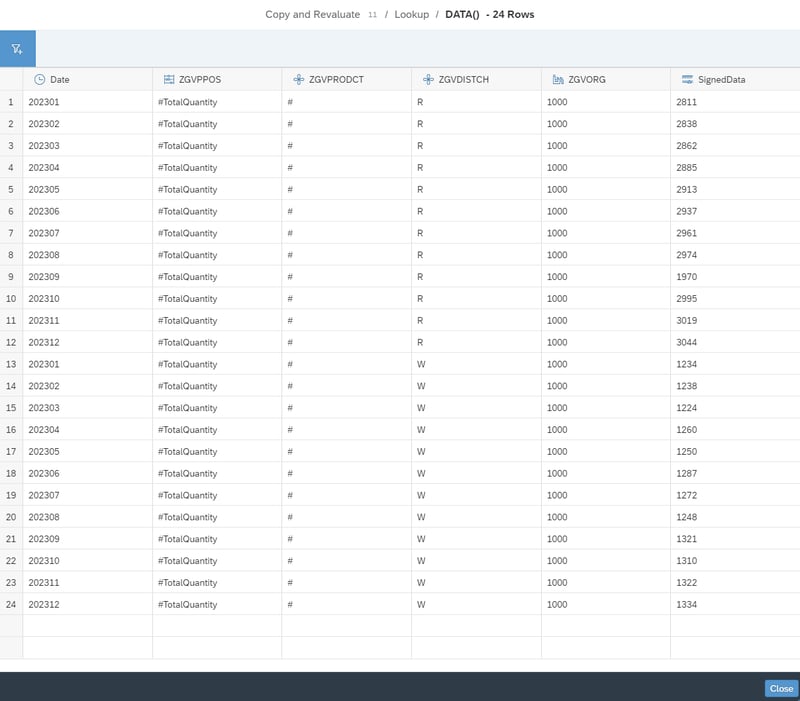
Under Lookup you can view virtual variable members, such as #TotalQuantity. After you click on the number of rows, a table with the data is displayed.
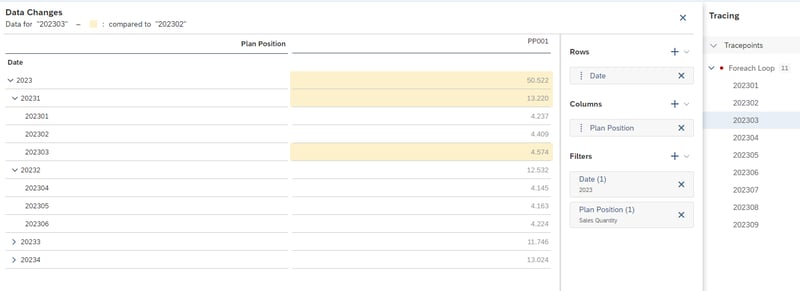
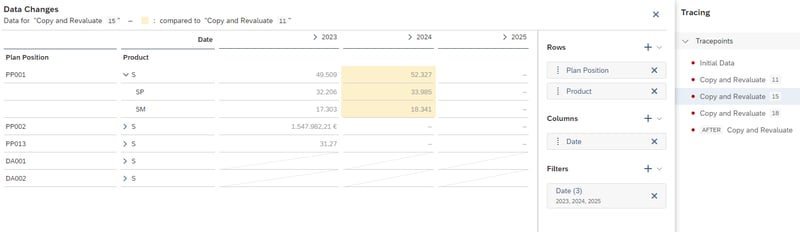
In addition to this information, SAP Analytics Cloud also offers an analysis window you can reach over the “Show Table” button. It displays the data for a particular tracepoint in a story-like table layout. Here you can configure the rows, columns, and filters to achieve the desired view. When you switch between tracepoints, the changes are highlighted in yellow.
If you are working with large amounts of data, SAP recommends running the tracing in the story itself instead of in the analysis window. In the next section, I'll show you how to do it.
Tracing in the story
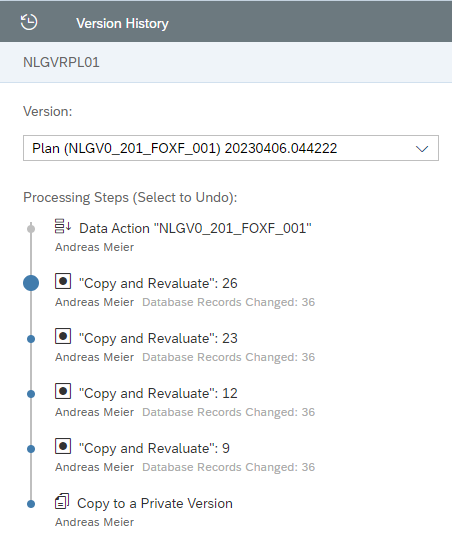
As you already know, a tracing version is created to display the trace log. This version can be viewed in the story. This is particularly useful when there are many values.
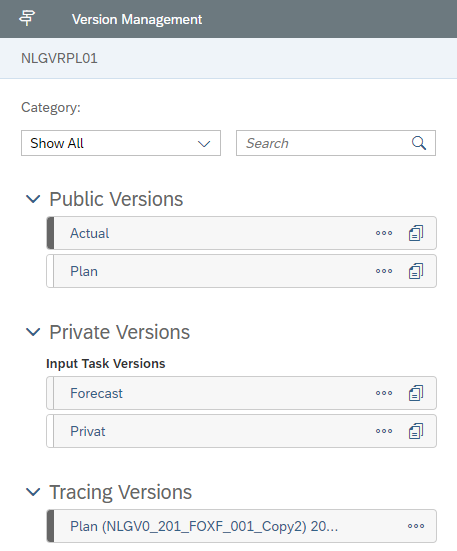
As you select the respective table, you can track the changes made via the Version Management and History options.
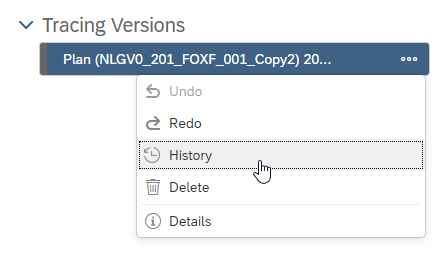
To do this, use the Processing Steps, which represent the tracepoints you have set. By going through the steps from bottom to top, you can see the changes directly in the story.
Debugging Feature - Our Summary
The debugging feature in SAP Analytics Cloud (SAC) was something I've been wanting for years. This is because the scripting logic in SAC takes some getting used to, especially for people coming from FOX programming backgrounds. Therefore, it is important to be able to understand step-by-step what the code you just created actually does and why the results differ from the expected result.
Finally, SAP has delivered. Even if the tracing approach differs from the well-known ABAP debugging, it is still helpful and provides insights into how the script works. Thus, SAC is one step closer to offering a full-fledged planning functionality.
Would you like to learn more about the planning possibilities of SAP Analytics Cloud? Are you trying to build up the necessary know-how in your department for SAP Analytics Cloud Planning? Or do you need support with a specific question? Request a non-binding consultation offer today!