/Logo%202023%20final%20dunkelgrau.png?width=221&height=97&name=Logo%202023%20final%20dunkelgrau.png)


Until now, planning in SAP Analytics Cloud (SAC) has mainly been implemented using stories. These provide a comprehensive selection of standard components that can be arranged on the user interface via drag & drop and customized via self-explanatory configuration. Within a very short time you can create applications for easy and quick entry of plan values.
In most cases, these standard functions are also sufficient to cover the requirements of the most users. However, sometimes the business department wants a special user interface to cover unique requirements of the planning process. In order to provide the best possible interface, an individual input mask is required. For example with drop down boxes or a calendar for data selection. Another example would be an individual navigation that guides the user through the respective steps of the planning process.
In this case, the story with its standard functions reaches its limits. To implement such requirements, you used to have to resort to the other tool, Analytics Designer. With this tool, you can create customized user interfaces in the form of web applications, so-called analytic applications. This provides you with additional user elements, such as drop-down boxes. Using JavaScript APIs, you can set the properties of these elements and process user input with specific logic.
In the past, it was necessary to estimate in advance how complex the planning interface would become and to choose either the Story or the Analytic Application. If additional, more complex requirements came later, the entire development had to be migrated from Stories to Analytic Applications. With the Optimized Story Experience, it's now a thing of the past. Because with Story 2.0, which has now been released, Analytic Applications are integrated into the story.
Whether you want to create simple stories or custom Analytic Applications, you now have the opportunity to use the new Optimized Story Experience. This combines the features of Stories and Analytic Applications. You can create custom interactions and add your own logic to the interfaces by integrating custom widgets and scripting.
The already existing stories with simple table input can now be easily extended with more complex logic. This creates a seamless continuum ranging from simple ad-hoc planning to sophisticated analytical applications. Which supports the agile development principles that are common today.
SAP Planning tools compared -
Dowload the Whitepaper here!
Your benefits
Now you can extend simple data entry via tables with user-specific elements. For example, using JavaScript as a scripting language, you can create event handlers that respond to specific events via custom script logic. You also have access to attributes and methods of the standard SAC elements and can customize them as you wish. This allows you to precisely control the behavior of the application and go beyond the default story behavior.
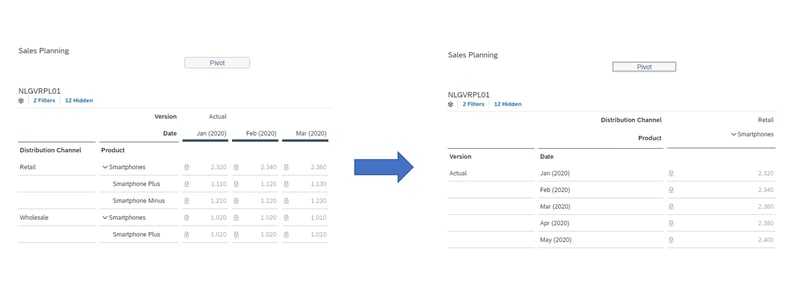
For example, you have two event handlers for buttons - onClick and onLongPress. One is called when the button is clicked, the other when the button is pressed and held. You can add your own programming logic to both to make the scheduling environment more flexible. In the following example, the drilldown is pivoted via a mouse click, i.e. the position of the rows and columns is swapped.
By extending existing stories with scripts, you can provide users with new ways to enter data. For example, users can enter plan values via text fields or sliders, which are then written back to the table and backend. This allows you to provide a more user-friendly data entry experience than manually typing values into a table.
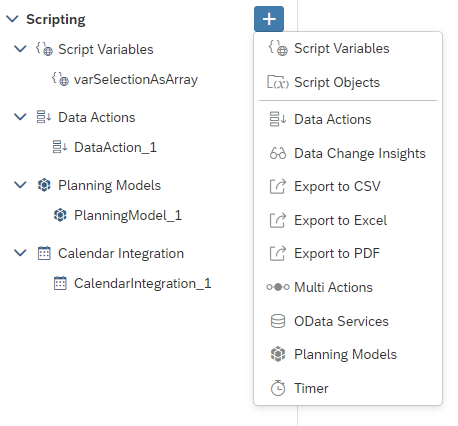
You can further increase flexibility by integrating additional objects into your planning application. You can create script variables and reuse them in further logic. Using the onInitialization() event, which is called when the application is started, you can set certain filter values, fill dropdown menus, determine the status of a version and so on.
With the help of the Planning Models object, you have direct access to the planning models and can read, adjust, create or delete elements of a dimension. This interface can be used to create new master data from the Analytic Application or to change the attribute values. For example, you can create new elements of a dimension on the fly using the createMembers() method. This is a common requirement in planning projects.
Planning in SAC Story 2.0 - Our Summary
From our point of view, merging Story and Analytic Designer is a reasonable step that was long overdue. If you create a planning application today, you no longer have to think about which tool to choose. All existing, and even future, requirements can be covered with story.
Moreover, you can extend the existing planning screens, which use simple table input, with additional elements with script logic. This simplifies user interaction with the planning application.
Would you like to learn more about the planning possibilities of SAP Analytics Cloud? Are you trying to build up the necessary know-how in your department for SAP Analytics Cloud Planning? Or do you need support with a specific question? Request a non-binding consultation offer today!