Planning in SAP Analytics Cloud (SAC) differs from its counterparts in BW Integrated Planning and BPC. In this article, I will explain step by step how to set up a planning application in SAC.
Create dimensions
Dimensions represent the building blocks of every application. The dimensions in SAC correspond to the InfoObjects in the SAP Business Warehouse. These represent a business evaluation object, such as customers or sales.
The dimensions can be easily created via a web interface. You can set options such as Data Access Control to activate the authorization check for this dimension. This allows you to restrict access to the data by setting read and write permissions for individual elements.
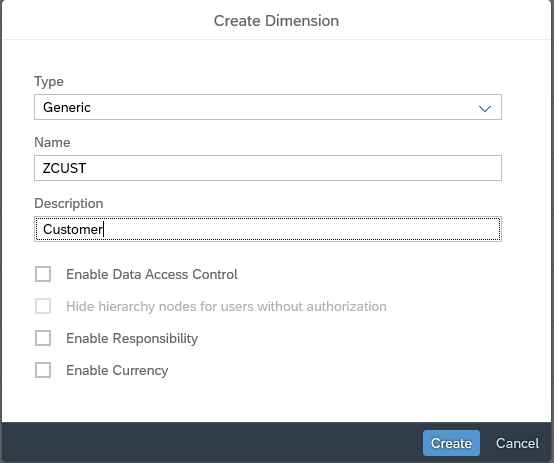
If you activate the Enable Responsibility option, the column “Person Responsible” is added to the dimension. This enables you to create an input task later, which prompts your colleagues to enter the plan values.
In addition, you can add the column "Currency" to the dimension via the option Enable Currency. In this column, you can use a three-character currency code to determine the source currency of the data.
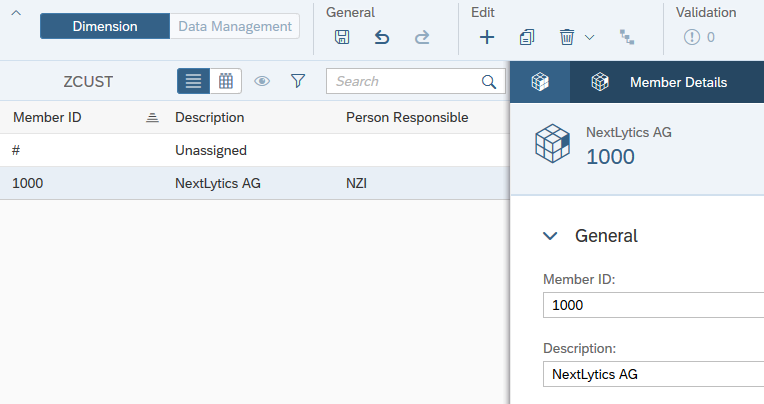
Particularly remarkable is the fact that the master data can be easily maintained online. This enables the business department to maintain its own entries, which is a frequent requirement in planning.
Create models
After the dimensions have been created, they are integrated into a so-called model. This model represents the business data of an organization or business segment.
There are several ways to create a new model. For example, you can use a file with data as a template. With this option, the model is created and immediately filled with transaction data. You can also use connections to other systems to create a new model from an external source. Alternatively, you can create models manually by selecting individual dimensions and customizing all settings and details of the model as desired.
Planning Tools compared - SAP BW IP vs. BPC vs. SAC
Create a planning layout
With the model, you have laid the foundation for your planning application. The dimensions served as building blocks. Now you can create a planning layout for data entry. You can choose between a story and an analytic application. The story is sufficient for simple data entry.
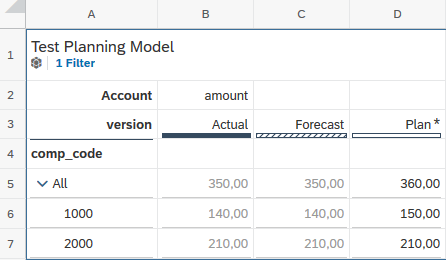
With an analytic application, you can customize the visualizations and the interaction behaviour of the interface. You can also include elements such as planning functions, which I will discuss in the following section. You can adjust the position of the respective elements with pixel accuracy.
Version management
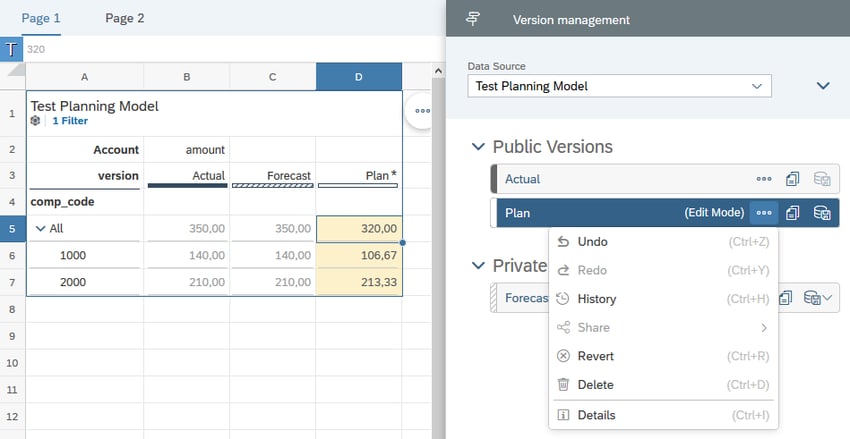
If you run through various simulation scenarios during your planning, you will love the version management built into SAC. It supports you in performing variance analyses, e.g. to make sure your plan is on budget. You can also create private, non-public, versions for tinkering. If you want to take a different direction, you can always revert to the previous status. This allows you to quickly analyze and release different scenarios without losing sight of the original data or creating unnecessary complexity.
Value driver trees
If you work with complex relationships in your simulations, you can use value driver trees. These represent the individual influencing factors visually.
For example, if you are wondering which product line should grow in the next few years to increase profitability the most, you can create a simulation in the form of a value driver tree. This allows you to visualize the overall impact on KPIs in subsequent years.
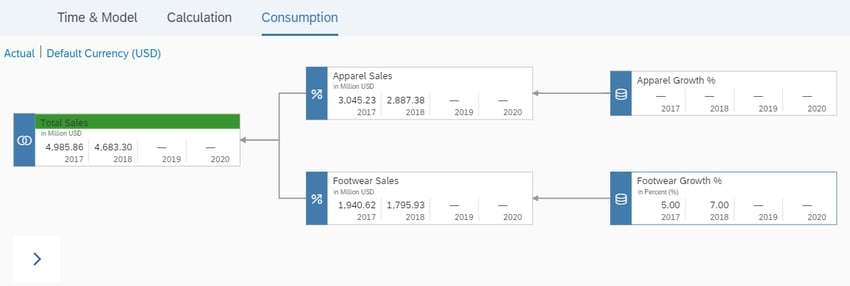
Value factor trees can be created automatically based on the account structure. You can also add your own calculations such as annual growth forecasts.
Create data actions
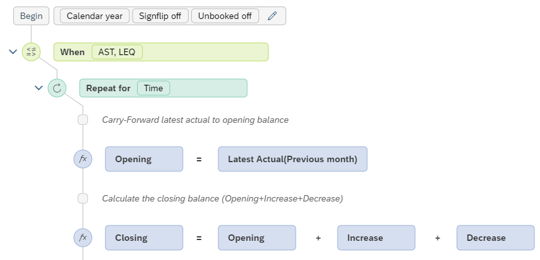
To use the current sales figures for your plan, you must copy data between the models. You can do this using data actions. You can also use the data actions to model complex processes such as cash flow planning, depreciation and carry-forward operations. You can make these calculations using the visual editor, supported by a scripting engine.
Data locking
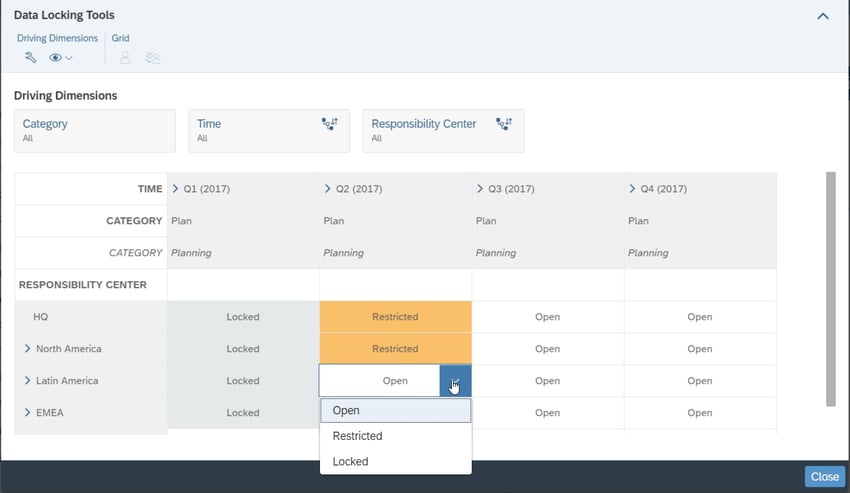
If you want to ensure that the plan values are not changed after the end of a planning cycle, you can protect them from changes throughout the system. You can also delegate individual areas to persons responsible, who can lock the data themselves. You can find more information about the input tasks in the next section. Alternatively, the data status can also be set to "Restricted" so that the data can only be edited by the owner.
Input tasks
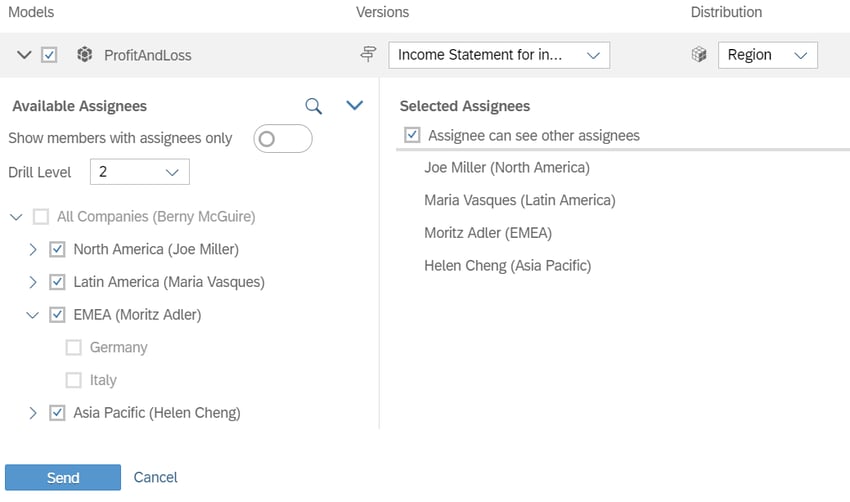
If you need information from other employees, such as regional managers, for your plan, you can assign them an input task to enter the data.
These managers are assigned to their regions within the model, so you only need to select the regions and submit the input task. After each manager has added their contribution to the story filtered for their region, they will send the task to you for review. When the process is completed, the results are posted to your version and you can continue with your work.
Forecast
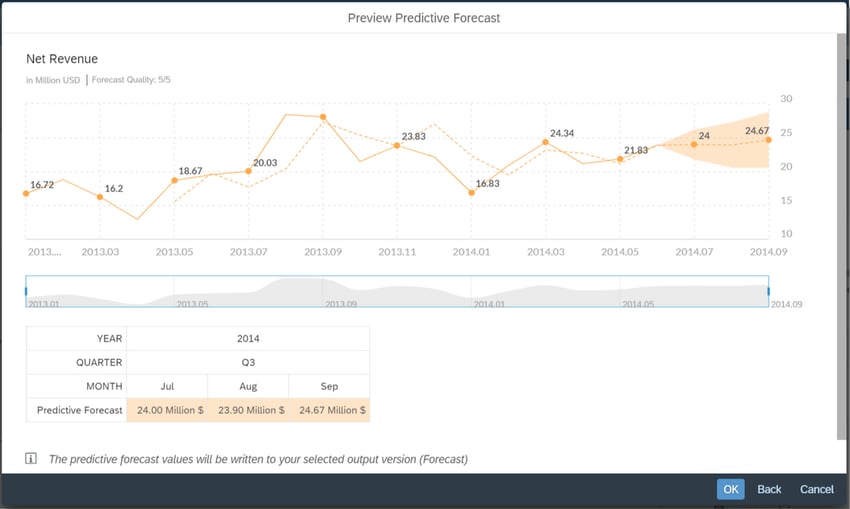
With the built-in forecast function, you don't have to rely solely on your intuition. You can back up your plans with statistical and mathematical methods. Simply select a value and calculate probable future results based on historical data. You can then insert the predicted values directly into your plan.
Our Summary - Planning in SAP Analytics Cloud
As you can see, SAP Analytics Cloud offers many options for designing your planning applications. All areas of application are covered - from simple data entry to complex calculations using statistical and mathematical methods. And thanks to the intuitive menu navigation, even business users can independently carry out ad hoc planning scenarios and simulations.
SAP Analytics Cloud, SAP Planning


