Since the Q4 2019 release, SAP Analytics Cloud (SAC) Application Designer allows users to develop their own widgets (components). In this article, I will explain what custom widgets are and how to implement them into SAC. To give you an idea of the various possibilities, I present the KPI widget developed by NextLytics.
Introducing Custom Widgets
In general, a widget is a separate component within SAC. It represents everything that you can visually see and edit in the Dashboard Builder. This can be either a diagram or other elements such as text or the tab strip. SAC already offers you a variety of elements with which you can design your dashboard. But what happens if you cannot see the specific application scenario using the predefined widgets? This is exactly where custom widgets in the Application Designer offer a remedy. They can be tailored exactly to your needs and thus implement the specific scenario.
These tailored components are developed by front-end developers in JavaScript (outside of SAC). In these custom widgets everything that is possible with JavaScript can be developed. These can be other types of diagrams, but also more complex widgets that can, for example, display a map of your building and then interact with it.
Since the Application Designer is always used when more complex scenarios need to be covered, the use of custom widgets is reserved for the Application Designer. However, SAP is also planning an introduction to SAC Story.
The actual custom widget must be stored on a separate server. To make this widget available in SAC, a JSON file is included in SAC. This file contains essentially all the information that describes this widget (metadata). This includes all descriptions for this widget within SAC as well as the storage location to the server and the interfaces used for programming in the Application Designer.
Inserting Custom Widgets
You can access all custom widgets via the menu->Browse->Custom Widgets.
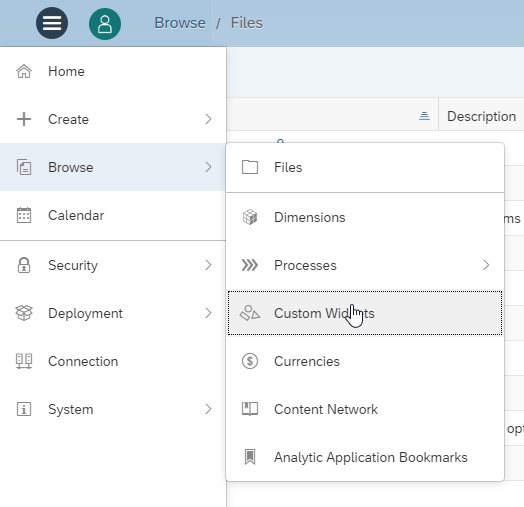
There you will get a list view of all custom widgets available in your Tenant.
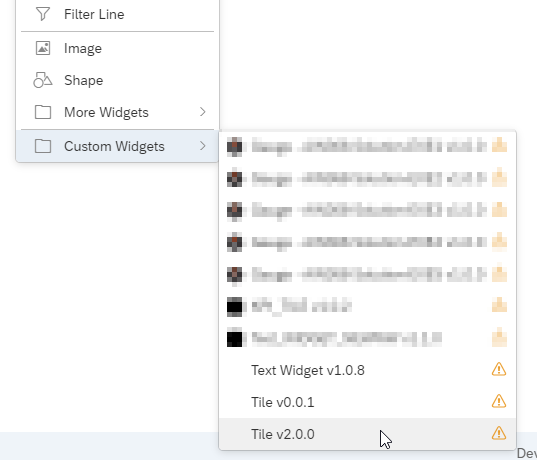
You then add the custom widget in an analytic application. To do this, click on Add in the menu and you can then find the custom widget in the last entry of this list via "Custom Widgets".
NextLytics KPI Tile
To give you a better feeling for the possibilities of the custom widgets, I now present the NextLytics KPI Tile.
KPIs are a main component of a dashboard. The application scenarios are different, but the visualizations are similar. If a KPI is added as a numeric point in SAC, the context of this KPI is usually missing. How can the KPI be placed in the timeline? What exactly does this KPI represent? As a user, I am only shown the absolute comparison value. How does the percentage value behave?
The NextLytics KPI Tile was developed for this scenario.
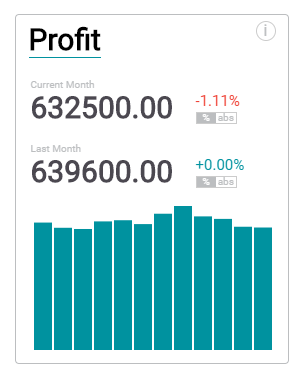
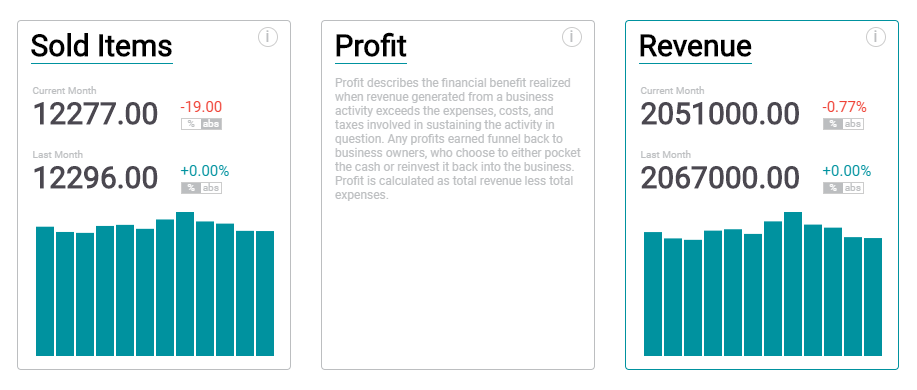
It basically consists of a heading, two KPIs with deviations and a bar chart. Using switch buttons, which are placed directly below the deviations, you can switch between absolute and relative deviations. If only one KPI is to be displayed, the secondary KPI can also be hidden via coding. The values for the KPIs are also via the coding as well.
Dashboarding with SAP Analytics Cloud -
Download the whitepaper here!

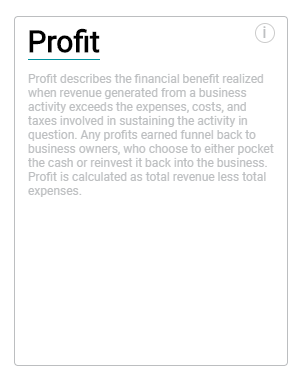
There is an info button in the upper right corner. This allows you to display the reverse side and a description.
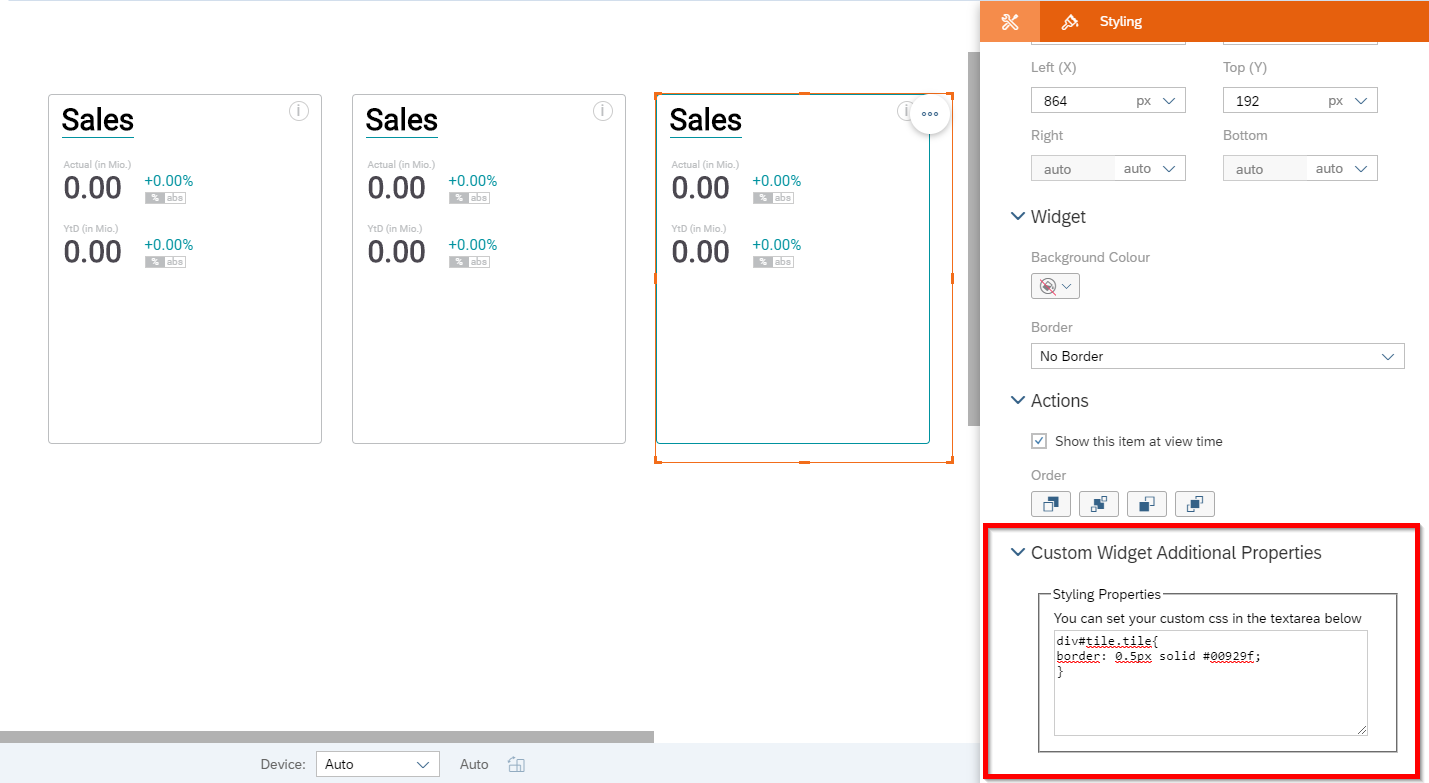
All elements can be edited via the coding. The special feature of this KPI Tile is that you can use CSS to edit the layout and thus align it with your corporate identity. Adjustments at CSS level are otherwise not possible in the Application Designer.
CSS can be stored directly in the styling panel.
Once a custom widget is integrated, it can be used in all Application Designer dashboards on your SAC Tenant.
It is not (yet) possible to connect a model (as with the charts or tables provided) for custom widgets. As you can see in our comparison document, the data binding is missing. This means that it is only possible to transfer key figures to custom widgets under certain circumstances. To do this, data from an already placed widget (tables are particularly suitable) must be temporarily stored and transferred using an array.
SAP Analytics Cloud Custom Widgets - Our Summary
Custom widgets can be useful for special applications. However, knowledge of HTML, CSS, and JavaScript is required, and they are primarily designed for Web developers. For the development of your own custom widget, it therefore makes sense for an SAP BW consultant with knowledge of SAC Application Designer and a Web developer to work together.
At the moment the connection of data is only possible under certain circumstances. However, as soon as data binding is supported, this workaround will be eliminated. We keep you updated and inform you as soon as data binding is possible!
Are you looking for support in implementing a custom widget for your requirements?

Are you interested in dashboarding with SAP Analytics Cloud? Here you can find more information: