Skip to content
NextLytics
Megamenü_2023_Über-uns

Shaping Business Intelligence

Whether clever add-on products for SAP BI, development of meaningful dashboards or implementation of AI-based applications - we shape the future of Business Intelligence together with you. 

Megamenü_2023_Über-uns_1

About us

As a partner with deep process know-how, knowledge of the latest SAP technologies as well as high social competence and many years of project experience, we shape the future of Business Intelligence in your company too.

Megamenü_2023_Methodik

Our Methodology

The mixture of classic waterfall model and agile methodology guarantees our projects a high level of efficiency and satisfaction on both sides. Learn more about our project approach.

Products
Megamenü_2023_NextTables

NextTables

Edit data in SAP BW out of the box: NextTables makes editing tables easier, faster and more intuitive, whether you use SAP BW on HANA, SAP S/4HANA or SAP BW 4/HANA.

Megamenü_2023_Connector

NextLytics Connectors

The increasing automation of processes requires the connectivity of IT systems. NextLytics Connectors allow you to connect your SAP ecosystem with various open-source technologies.

IT-Services
Megamenü_2023_Data-Science

Data Science & Engineering

Ready for the future? As a strong partner, we will support you in the design, implementation and optimization of your AI application.

Megamenü_2023_Planning

SAP Planning

We design new planning applications using SAP BPC Embedded, IP or SAC Planning which create added value for your company.

Megamenü_2023_Dashboarding

Dashboarding

We help you with our expertise to create meaningful dashboards based on Tableau, Power BI, SAP Analytics Cloud or SAP Lumira. 

Megamenü_2023_Data-Warehouse-1

SAP Data Warehouse

Are you planning a migration to SAP HANA? We show you the challenges and which advantages a migration provides.

Business Analytics
Megamenü_2023_Procurement

Procurement Analytics

Transparent and valid figures are important, especially in companies with a decentralized structure. SAP Procurement Analytics allows you to evaluate SAP ERP data in SAP BI.

Megamenü_2023_Reporting

SAP HR Reporting & Analytics

With our standard model for reporting from SAP HCM with SAP BW, you accelerate business activities and make data from various systems available centrally and validly.

Megamenü_2023_Dataquality

Data Quality Management

In times of Big Data and IoT, maintaining high data quality is of the utmost importance. With our Data Quality Management (DQM) solution, you always keep the overview.

Career
Megamenü_2023_Karriere-2b

Working at NextLytics

If you would like to work with pleasure and don't want to miss out on your professional and personal development, we are the right choice for you!

Megamenü_2023_Karriere-1

Senior

Time for a change? Take your next professional step and work with us to shape innovation and growth in an exciting business environment!

Megamenü_2023_Karriere-5

Junior

Enough of grey theory - time to get to know the colourful reality! Start your working life with us and enjoy your work with interesting projects.

Megamenü_2023_Karriere-4-1

Students

You don't just want to study theory, but also want to experience it in practice? Check out theory and practice with us and experience where the differences are made.

Megamenü_2023_Karriere-3

Jobs

You can find all open vacancies here. Look around and submit your application - we look forward to it! If there is no matching position, please send us your unsolicited application.

Blog
NextLytics Newsletter Teaser
Sign up now for our monthly newsletter!
Sign up for newsletter
 

How to create forecasts with SAP Analytics Cloud for Planning

SAP Analytics Cloud (SAC) enables you to create time series forecasts within a story. An algorithm uses historical data to predict future values. The result of the forecast can then be used in the planning process. In this article I will present the forecast function in detail. 

Create forecast

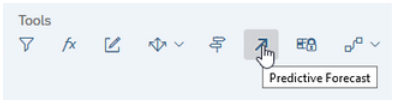
You can easily create the forecast within the story. To do so, click on Predictive Forecast in the Tools menu.

Predictive Forecast

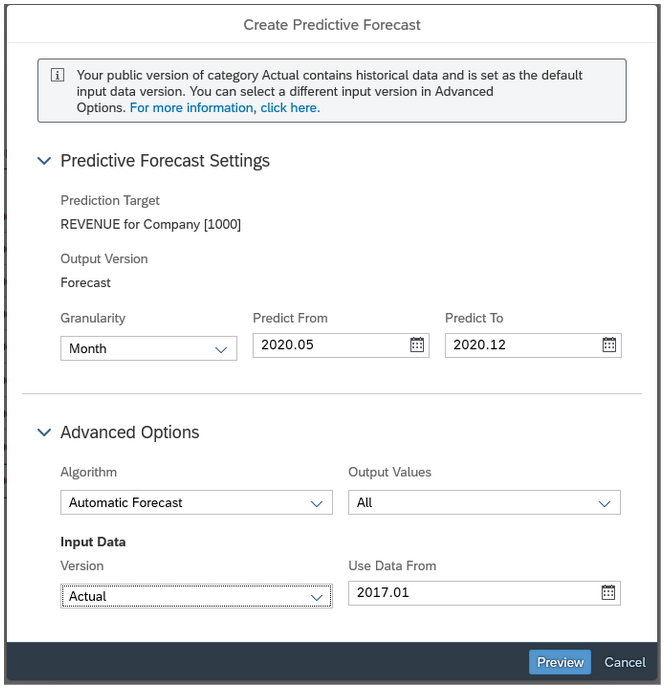
When executing the forecast, you can specify the time interval for the forecast and the past periods whose data you want to use as a basis. You can also determine the granularity of the forecast by specifying whether the forecast is to be created on a monthly, quarterly, half-yearly, or annual basis.

Create predictive forecast

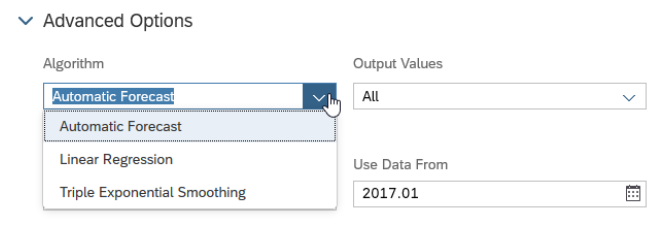
In the next step you have the possibility to select the algorithm to be used. You can choose between 'automatic forecast', 'linear regression' and 'triple exponential smoothing'. You can also specify whether only positive values should be taken into account.

Advanced options

Then a preview of the forecast is displayed, which contains the previous actual values together with the forecast values, which are displayed both as a diagram and in the form of a table. The upper and lower limits of the confidence interval are also displayed.

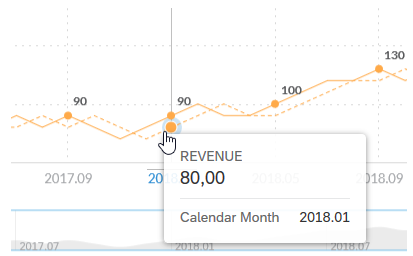
The solid line represents the past values and the dashed line shows the forecast values. The confidence interval is shaded.

Preview predictive forecast

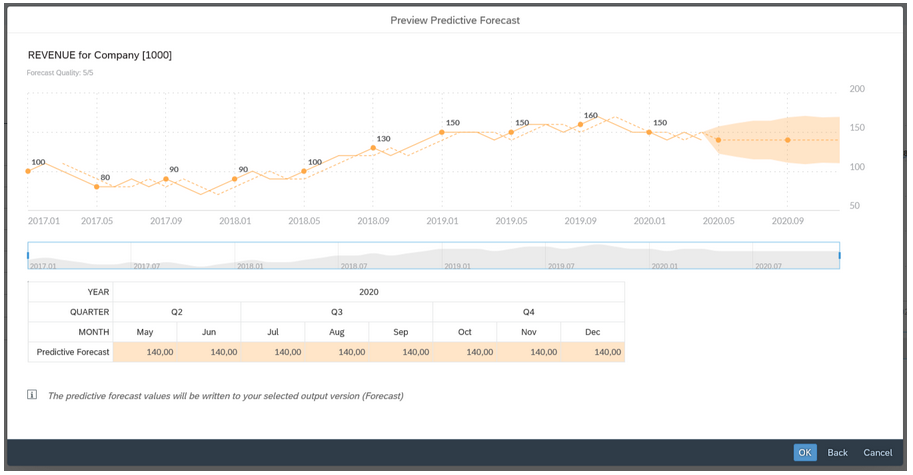
You can move the mouse over the individual points to display details. You can compare the predicted and actual values.

Forecast details


   Planning Tools compared - SAP BW IP vs. BPC vs. SAC

Neuer Call-to-Action


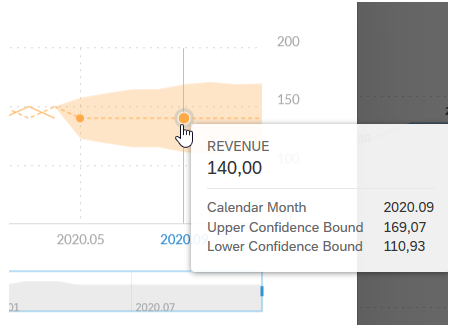
A confidence interval is also shown for future values for which there were no values. The confidence interval indicates the range in which the future values are likely to lie.

Confidence intervall

The forecast data can then be transferred to the plan.

Limitations

When working with forecasts you have to accept some restrictions. For example, the underlying model may only contain one time dimension. Weekly forecasts cannot be generated because a month is the most granular level that can be used. Finally, forecasts cannot be created for calculated key figures, formulas and composite data sets.

Forecasts with SAP Analytics Cloud - Our Conclusion 

In summary, the integrated forecast function provides good support in the planning process. In this way, future values can be derived that are based on statistical-mathematical methods instead of pure previous year's values.

A negative aspect is the very limited selection of algorithms. You can only choose between three algorithms for time series prediction and cannot apply your own models. The available algorithms are very simple models that are not capable to correctly replicate complex dependencies. For this reason, the generated forecasts should always be treated with caution and should only be understood as a rough guide.

Furthermore, it is not possible to control the forecast parameters. Thus the system represents a black box and it is not possible to understand how the respective result is achieved.

If you want to improve your forecasts while maintaining full insight and control, we recommend our white paper “SAP BW and State of the Art Machine Learning”. In this paper, we examine SAP's machine learning portfolio and make clear recommendations, how you can generate valuable insights from your data.


Learn all about Planning with SAP Analytics Cloud

, ,

avatar

Chris

Chris Fidanidis has been working in the SAP BW environment since 2007. During these years he has implemented several planning projects and used various SAP tools such as SAP BSP, SAP BW-IP, SAP BPC, SAP BW Embedded BPC. He has gained experience primarily as a developer, architect, project manager and team leader. He enjoys playing basketball and barbecue whenever possible.

Got a question about this blog?
Ask Chris

Blog - NextLytics AG 

Welcome to our blog. In this section we regularly report on news and background information on topics such as SAP Business Intelligence (BI), SAP Dashboarding with Lumira Designer or SAP Analytics Cloud, Machine Learning with SAP BW, Data Science and Planning with SAP Business Planning and Consolidation (BPC), SAP Integrated Planning (IP) and SAC Planning and much more.

Subscribe to our newsletter

Related Posts

Recent Posts