/Logo%202023%20final%20dunkelgrau.png?width=221&height=97&name=Logo%202023%20final%20dunkelgrau.png)


A few weeks ago, we presented the main new features of the Tableau Q3 2022 release in our blog. One of the features coming along with the new release particularly caught our interest, so we decided to dedicate a separate article to it. Dynamic Zone Visibility enables users to dynamically show and hide worksheets or entire dashboard sections. Adding this kind of visibility control opens up a whole new world of possibilities for Tableau developers when creating dynamic dashboards, which we will describe in more detail in this article. But first, let's take a look at what options for showing and hiding objects Tableau dashboard developers had before the new release.
Show and hide? That was already possible previously.
That's right. Show and hide features were already available in Tableau before. Back in mid-2019, Tableau introduced a new feature that allows users to control the visibility of containers and individual worksheets via a button. However, this option is only available for floating objects that are not fixed to the grid. Using such objects poses some risks when the dashboard size is determined dynamically. Resizing can cause objects that are not anchored to the grid to shift unexpectedly and cover important information from other charts. Therefore, it is best practice to use tiled objects and use this feature only in exceptional cases. Statically showing and hiding containers is thus less suitable for charts, but rather for filter- and other control elements.
Luckily, members of the Tableau Community came up with an interesting workaround to bypass these restrictions. By linking worksheets with a display parameter using a filter condition it is possible to show and hide visualizations by adjusting the parameter selection. The filter ensures that only the selected worksheet contains data. In fact, the other worksheets are not hidden, but simply empty, since all data is "filtered out" and therefore cannot be visualized. This gives the impression that different worksheets can be dynamically shown, hidden or swapped by selecting the charts to be displayed via the parameter's drop-down menu. Of course, the parameter value can also be changed by setting up a Parameter Action and selecting a data point within a visualization. In fact, however, the worksheets are only collapsed and remain visible. When closely examining the dashboard via mouseover, you will notice an empty worksheet frame that takes up a few pixels and could cause confusion for the report recipient. As the workaround is only removing the viz and not the worksheet itself, it only works if the title of the worksheet is manually hidden.
As you can tell, the previous methods for controlling the visibility of individual worksheets were quite limited and came with certain drawbacks. The Q3 2022 release remedies these issues and replaces existing workarounds once and for all.
Using Dynamic Zone Visibility, the visibility of dashboard elements can now be directly linked to a parameter or a calculated field of type Boolean. Whether the object is finally shown or not then depends on the value (True or False) of the underlying field/ parameter. Thus, there is no need to set up different filter conditions on the various worksheets anymore. For developers, this means less work in developing the dashboard, and for report recipients, it means better performance because fewer filter conditions need to be evaluated. In addition, the object is completely hidden, so the annoying empty frame of the previously described solution is gone. Unlike the cumbersome workaround, the new logic can be applied not only to individual worksheets, but also to entire dashboard sections, since you can also link containers to a parameter.
How to use Dynamic Zone Visibility
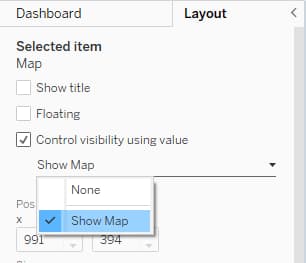
In the most simple case, you link the dashboard element directly to a Boolean type parameter. To do this, activate the "Control visibility using value" option for the respective element and select the parameter to be used for display control. If you then add the parameter control to the view, the worksheet or container can be dynamically displayed and hidden using the control element.
 Use Cases
Self-Service Analytics with Tableau -
Download the whitepaper here!

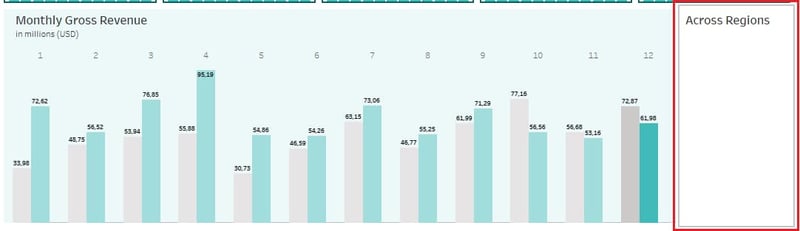
Displaying/ Hiding an object usually affects the size of the remaining objects in the container, since changing the contents of a container results in a resizing of the remaining elements. However, if the hidden element leaves a blank space on your dashboard, the dimensions of the remaining objects are fixed, so no resizing can occur here. Select the other objects and make sure the pin icon is not active. There is no impact on the size of the parent container
![]()
To get the most out of the Dynamic Zone Visibility feature and better control the effects on the size and positioning of the remaining dashboard objects, we recommend that you work with nested containers. However, this requires a thorough understanding of how layout containers work. We've already summarized everything you need to know about containers in this blog article.
In case you only want to display charts by clicking on a button, it is sufficient to link the worksheet directly to a Boolean parameter. However, exciting applications are possible when you control the visibility of your worksheets using a calculated field instead. Using calculated fields, you can implement complex logic to control the visibility, making use of parameters of other data types such as string and integer, as well as parameter actions.
Advanced Use Cases
As already mentioned, there are many possible use cases and they go far beyond simply showing and hiding or exchanging individual charts. In the following, we therefore describe some exciting scenarios.
Dynamic Dashboards
A major factor for the success of a dashboard project is the identification of target groups as part of the requirements analysis. Sometimes, however, the information needs and therefore the dashboard requirements for different users differ marginally even within a given target group. A dashboard tailored to a group of recipients is often a compromise because it is not efficient to create user-specific dashboards. While developers can allow users to dynamically swap key figures and save them along with the rest of their filter settings in a personalized Custom View, switching between personalized versions with a different chart structure within a dashboard has not been possible. Until now. With Dynamic Zone Visibility, end users can now easily hide charts and tables that are less relevant to them, and vice versa. Since visibility usually depends directly or indirectly on a parameter and its values can be stored in a custom view, users can save their dashboard versions created in this way and access them effortlessly. Developers can also link parameters to the logged-in users and directly provide individual user groups with their own version.
Of course, we do not recommend using the feature to develop a single dashboard for a large number of different audiences. Despite being hidden, the charts load in the background, so even hidden charts will affect performance. Still, it makes maintenance much easier if you include hideable visualizations in the dashboard, rather than providing a nearly identical second dashboard for a tiny group of users.
In addition, a dynamic dashboard structure is also useful for switching between different analysis scenarios via user interaction, without having to switch back and forth between multiple dashboard pages.
Hideable Sidebar
Another possible use is to place controls for filters and parameters in a separate container and display it only as needed. After setting filters and parameter values, all controls can be hidden, leaving more space for the visualizations.
Full screen mode for specific visualizations
As described above, when a dashboard object is hidden, the remaining worksheets of the container are resized. Therefore, to maximize a particular worksheet within the dashboard, you only need to hide the other worksheets.
Dynamic Zone Visibility is a real game changer. The new feature not only replaces existing workarounds, but also creates completely new possibilities for creating dynamic Tableau dashboards that go far beyond the interaction possibilities that were available up until now. Since this is a fairly new feature, the potential is not yet fully tapped. Surely, in the coming weeks and months, some new promising ideas for using this feature that we haven't thought of at the time of writing this article will emerge. Of course, we will update the article accordingly and add interesting use cases. Subscribe to our newsletter here to not miss upcoming updates.
Are you interested in the topic of Tableau? Are you trying to build up the necessary know-how in your department? Or do you need support with a specific question? Request a non-binding consulting offer today.