Blending refers to the linking of data from different data connections. In the context of SAP Analytics Cloud, a data connection can be an imported (acquired data) or live connection. Blending is possible with the two connection types mentioned above. Ultimately, it is a join of content from different data connections. If blending is now considered in the SAC context, a local file is often linked to a live data connection. In this blog article, I will deal with data blending in SAP Analytics Cloud Story and present a possible scenario.
For blending, the data is transferred to the SAP Analytics Cloud via secure channels and stored in a cache for the duration of the blending: (https://launchpad.support.sap.com/#/notes/2715871)
To make the procedure a little more transparent, I will introduce you to four steps in the following.
Goal
The goal is to combine and visualize the data of a chart with two different models. The first model is a query from an SAP BW system and is connected live. The second model is a local Excel file that we import into SAC later on.
Step 1: Preparation
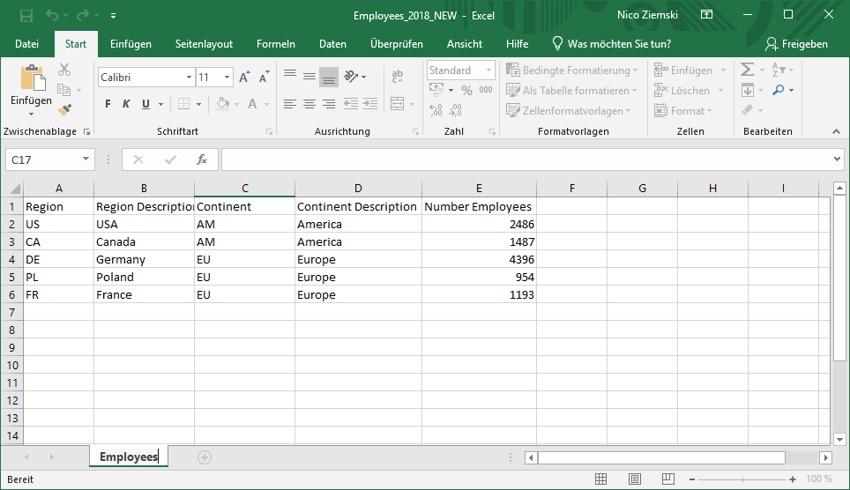
First you have to consider which fields can serve as key fields and to what extent they can be integrated into the existing data model. In this case, the dimension Continent and the key figure Number of Employees should be linked to the existing live data. In the previous model, the Region field is suitable as a key field. This field is added to the local Excel file and linked to the continents.
Step 2: Import into SAC
The next step is to switch to the Data View and select Add New Data from the dropdown on the left. The local file is selected from the popup and the check mark is set so that the first row serves as the column header. The contents can then be transformed and adjusted (just like when creating a model). If the new model is now saved, it is initially set to Private so that it is only available for the creator and only for the current story.
Note: Microsoft Excel files (XLSX) can be uploaded with a size of 200 MB, CSV files with a size of 2 GB. The number of lines is not taken into account:
https://help.sap.com/viewer/00f68c2e08b941f081002fd3691d86a7/release/en-US/5f61b6509a5e4d499e8cb9685f32db73.html
Dashboarding with SAP Analytics Cloud -
Download the whitepaper here!

Step 3: Linking the Models
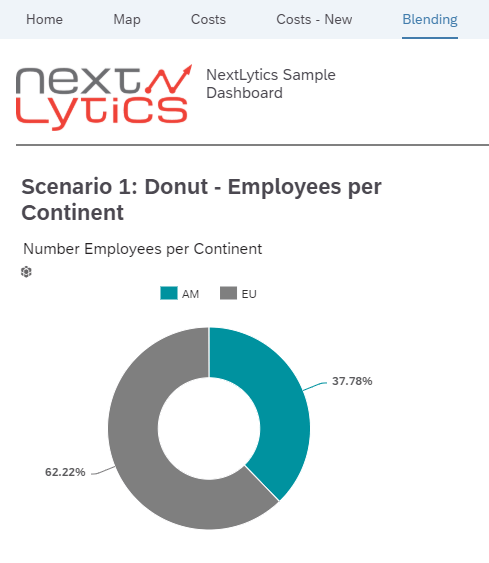
In order to see whether the just imported key figures can be visualized, a simple pie chart is created and the number of employees selected by continent. This data can be easily visualized.
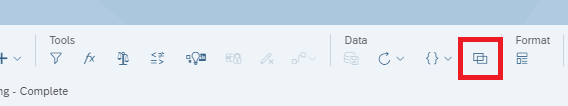
If you now want to blend the data with a live connection, the models must first be linked together. In the upper (symbol) menu, the "Link Dimensions" entry is located in the "Data" area (represented by two overlapping rectangles).
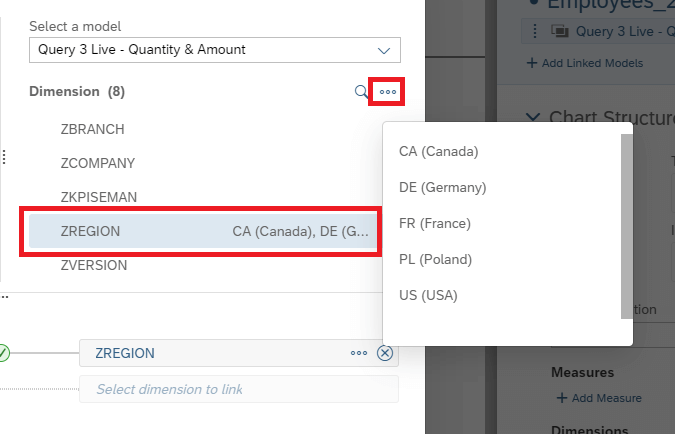
All linked dimensions are listed in this popup. With a click on "Add Model Link" a new link can be added. Now select the two models to be linked. For the present scenario, the regions are linked together. The link is confirmed by a green tick. Under the dropdown and next to the dimension of the model, the data examples can be changed using the action button.
In some cases it is necessary to link the description and not the ID (this can happen, for example, if the Acquired Data Connection is used and the ID and description of a dimension are transferred in two separate columns). This is changed using the action button next to the selected model.
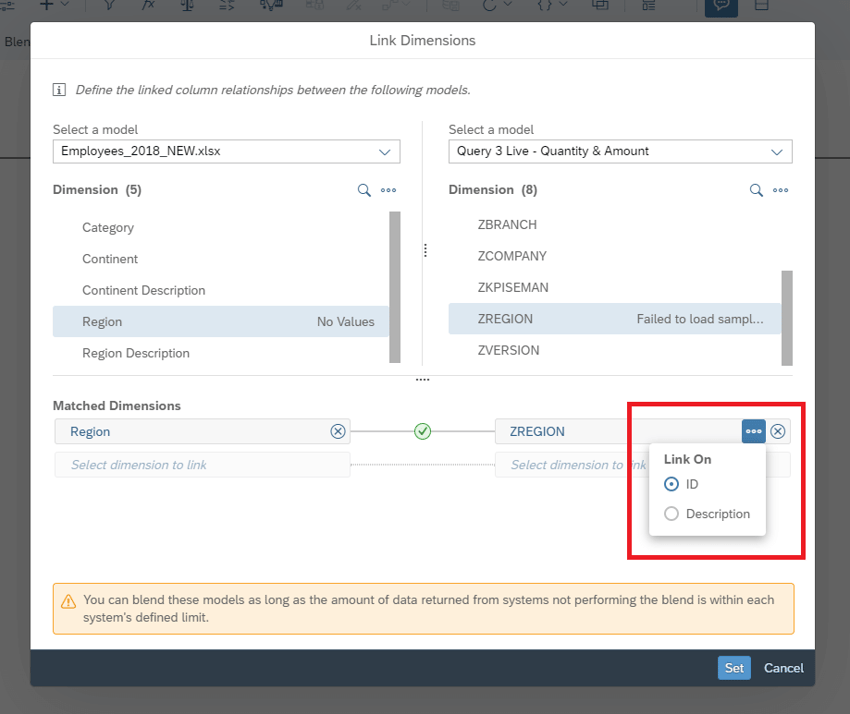
If linked incorrectly, this can lead to distorted results and possibly to a consistent, aggregated presentation of the key figures.
Step 4: Data Blending
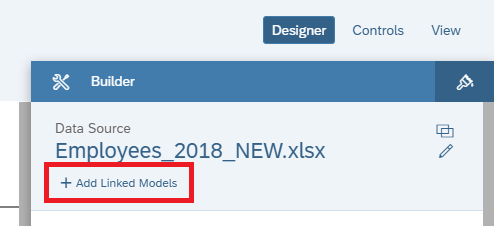
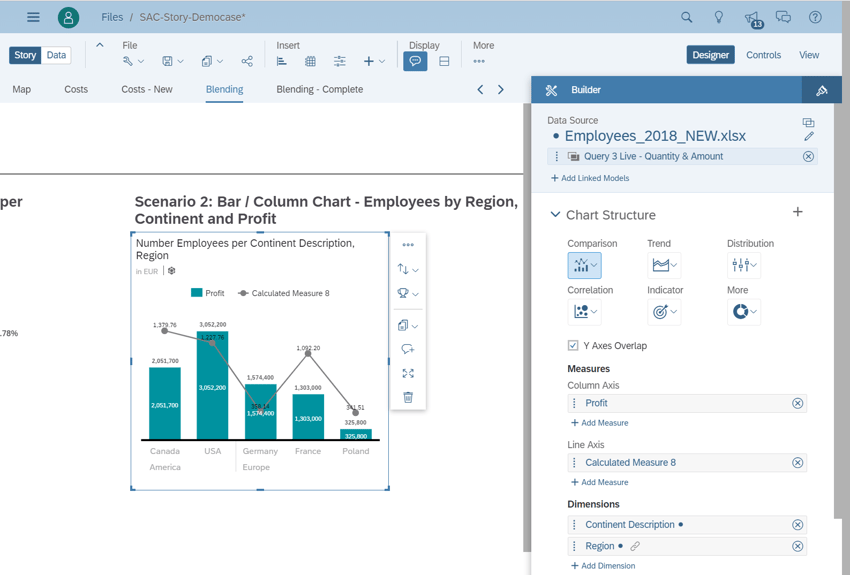
After the conditions for data blending have been created in the last steps, the actual data blending takes place in step four. First, a new bar chart is added. In order to merge the linked models, the linked model must first be added.
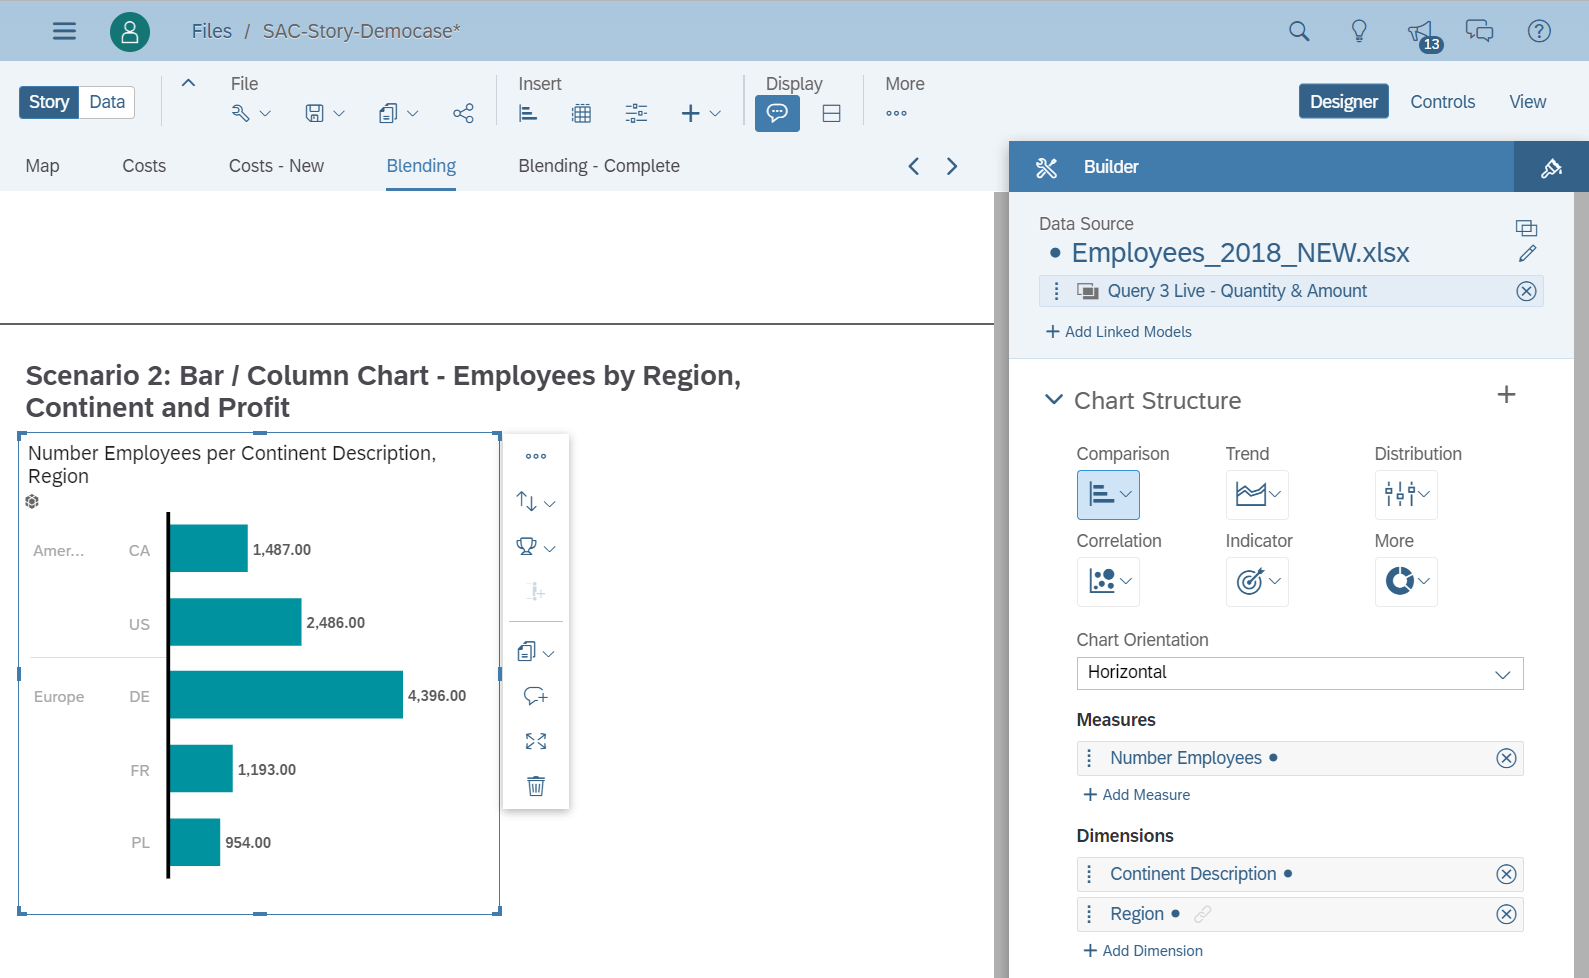
Key figures or dimensions of both models can now be selected. The primary model is represented by a blue circle, while the linked model is represented by two overlapping rectangles.
In the bar chart, the dimension selected is the continent and the regions (you can recognize the linked dimension here by the link symbol). The number of employees is selected as the key figure. All previous data comes from the Excel file.

The KPI Profit is selected to also display key figures that have been linked to the data from Excel. To change the direction of the blending (join), it can be adjusted next to the linked model using the action button (context menu Link Type).
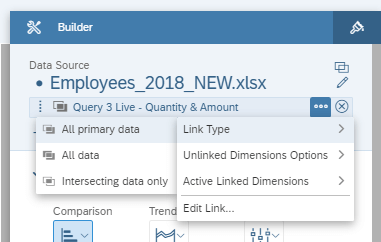
You can also set what happens to the unlinked dimension entries (Unlinked Dimensions Options) or what the actively linked dimension is. It is also possible to link several models.
Tip: To check the values linked by blending, it is a great idea to use a table as a help. There you can gradually add and check the key figures.
A calculation can also take place at this point, so that, for example, the turnover per employee can be displayed.
Data Blending with SAP Analytics Cloud Story - Our summary
In this article, we mainly looked at blending in the context of an imported Excel file. Blending with other models (Live- or Acquired) works on the same principle and is slightly easier. In an Excel file, for example, you have to make sure that the key fields are defined correctly (e.g. to avoid typos). For an end user from the department, this may require several attempts until the correct format for blending is available.
For this reason, the IT department should set it up once only. This can include the setup, the creation of templates, as well as (Excel) templates for blending.
Note: Blending also includes the other connection types as well as the connection types among each other. In order to enable a blending scenario with a live connection, a lot of preparation has to be done on the backend side. So it makes sense to import the latest Release Notes, if possible even the latest Support Packages. SAP provides a program with which you can examine your system requirements and identify missing Release Notes: (https://launchpad.support.sap.com/#/notes/2541557)