/Logo%202023%20final%20dunkelgrau.png?width=221&height=97&name=Logo%202023%20final%20dunkelgrau.png)


In today's article in our "Dashboarding with Tableau" blog series, we will add buttons to our KPI tiles to help users navigate to other dashboard pages and allow them to dynamically modify the bar chart, which we created in the last blog article. To set up shortcuts to other pages, we will use the buttons already predefined in Tableau. While doing so, you'll learn about the limitations of the available out-of-the-box buttons and why many of the use cases you surely have in mind probably can't be implemented using them. But don't worry. Afterwards, we will show you a simple workaround that allows you to create your own buttons and add various features to them using dashboard actions.
Our Blog Series "Dashboarding with Tableau" at a glance
|
Using predefined buttons
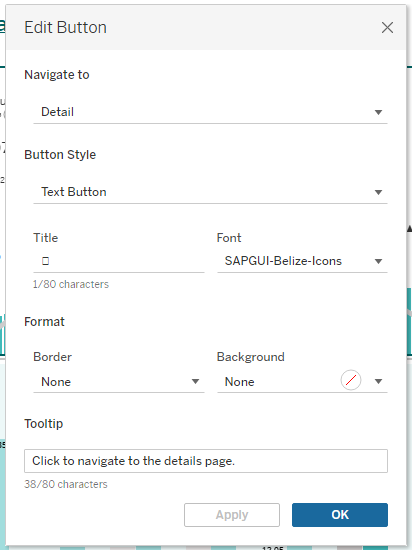
While creating a dashboard, two types of buttons are available to the user: Buttons to navigate to another page and buttons to export the current view. We add a navigation element to the dashboard from the layout area and open the settings via its context menu. Here we can define which page should be called when the button is clicked. Unfortunately, only worksheets and dashboard pages can be linked. Forwarding users to URLs, on the other hand, is a little more complicated. In addition to defining the target site, you can also edit the button's appearance and tooltip. Instead of uploading an image for the button, we advise you to import an icon font into your Tableau repository and set the desired icon as the title. When using text buttons, you will benefit from the additional formatting options of the font. We use a freely available SAP icon font.
How to create buttons on separate worksheets
Next, we would like to enable the user to exchange the key figure displayed in the bar chart via a button. If you have read the previous article in this series, you already know that this requires adjusting a parameter. Unfortunately, Tableau does not have predefined buttons that can be used to change parameter values. Therefore, we create our own button on a separate worksheet. On the new sheet we will store one of the different key figure names as a value in the marks card, in order to be able to pass it to the parameter later via Dashboard actions.
Self-Service Analytics with Tableau -
Download the whitepaper here!

Our worksheet will only display the actual icon symbol. To do this, we place the desired icon on the text container in the marks card. For a better overview, however, we do not create calculated fields for the icons as usual, but add the fields on worksheet level via a double-click in the lower area of the marks card. Overall 4 new fields are required
- Placeholder for the icon text
- Icon text (active)
- Icon text (inactive)
- Key figure name to be passed to the parameter
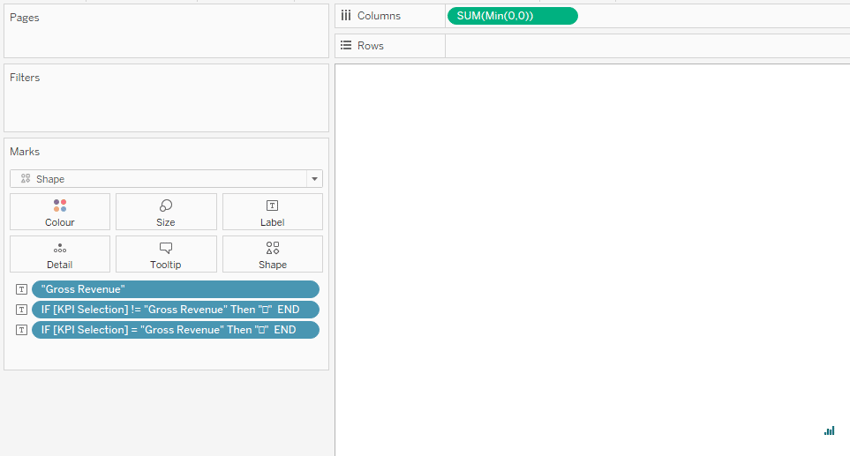
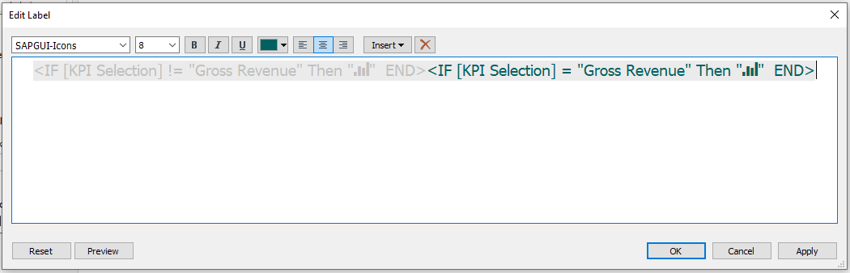
In the final dashboard, there are 5 different KPI tiles, each of which should have its own custom button. To make navigation easier for the user, we want to highlight the active button, which is related to the current value of the parameter. We therefore create two icon fields for each button to differentiate between the two states active and inactive. The defined condition ensures that only one of the two fields outputs the icon, regardless of the valid parameter value. We include both fields with different font colors in the label of the worksheet, so that later it is clear from the color whether the button is active or not.
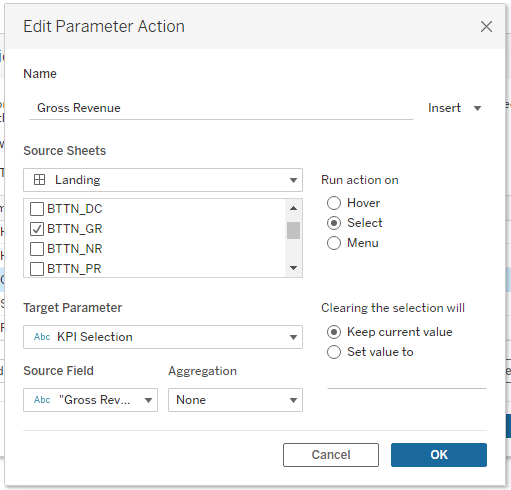
Then we create the following action under Worksheet > Actions to pass the specified key figure name to the parameter when the button is clicked. It should be ensured that only the respective worksheet is defined as the source sheet.
After the worksheet has been formatted accordingly, for example by hiding the headers and background lines, the button can be added to the dashboard. You may have to experiment a bit with the font size of the label until you find a suitable setting. In our case, we set the size to 8 (the above setting was just for better visibility in the screenshot). Also, make sure the label is centered and the option Fit Entire View is selected in the worksheets context menu.
Tableau Buttons - Our Conclusion
The buttons available out-of-the-box in Tableau offer only very limited capabilities. While jumping to other dashboard pages or exporting the current view are common use cases, they are hardly ever sufficient for more complex dashboarding needs. Creating buttons on separate worksheets requires a bit more effort, but allows you to implement your own logic using dashboard actions. You are by no means limited to parameter actions. You could also create an action that redirects your users to an external URL such as NextTables, passing specific parameters to the application.
Do you have questions about this or other topics? Then feel free to contact us! As Tableau partner, we are happy to advise you on all aspects of deployment, administration and best practices for effective Tableau Dashboards.