Skip to content
NextLytics
Megamenü_2023_Über-uns

Shaping Business Intelligence

Whether clever add-on products for SAP BI, development of meaningful dashboards or implementation of AI-based applications - we shape the future of Business Intelligence together with you. 

Megamenü_2023_Über-uns_1

About us

As a partner with deep process know-how, knowledge of the latest SAP technologies as well as high social competence and many years of project experience, we shape the future of Business Intelligence in your company too.

Megamenü_2023_Methodik

Our Methodology

The mixture of classic waterfall model and agile methodology guarantees our projects a high level of efficiency and satisfaction on both sides. Learn more about our project approach.

Products
Megamenü_2023_NextTables

NextTables

Edit data in SAP BW out of the box: NextTables makes editing tables easier, faster and more intuitive, whether you use SAP BW on HANA, SAP S/4HANA or SAP BW 4/HANA.

Megamenü_2023_Connector

NextLytics Connectors

The increasing automation of processes requires the connectivity of IT systems. NextLytics Connectors allow you to connect your SAP ecosystem with various open-source technologies.

IT-Services
Megamenü_2023_Data-Science

Data Science & Engineering

Ready for the future? As a strong partner, we will support you in the design, implementation and optimization of your AI application.

Megamenü_2023_Planning

SAP Planning

We design new planning applications using SAP BPC Embedded, IP or SAC Planning which create added value for your company.

Megamenü_2023_Dashboarding

Dashboarding

We help you with our expertise to create meaningful dashboards based on Tableau, Power BI, SAP Analytics Cloud or SAP Lumira. 

Megamenü_2023_Data-Warehouse-1

SAP Data Warehouse

Are you planning a migration to SAP HANA? We show you the challenges and which advantages a migration provides.

Business Analytics
Megamenü_2023_Procurement

Procurement Analytics

Transparent and valid figures are important, especially in companies with a decentralized structure. SAP Procurement Analytics allows you to evaluate SAP ERP data in SAP BI.

Megamenü_2023_Reporting

SAP HR Reporting & Analytics

With our standard model for reporting from SAP HCM with SAP BW, you accelerate business activities and make data from various systems available centrally and validly.

Megamenü_2023_Dataquality

Data Quality Management

In times of Big Data and IoT, maintaining high data quality is of the utmost importance. With our Data Quality Management (DQM) solution, you always keep the overview.

Career
Megamenü_2023_Karriere-2b

Working at NextLytics

If you would like to work with pleasure and don't want to miss out on your professional and personal development, we are the right choice for you!

Megamenü_2023_Karriere-1

Senior

Time for a change? Take your next professional step and work with us to shape innovation and growth in an exciting business environment!

Megamenü_2023_Karriere-5

Junior

Enough of grey theory - time to get to know the colourful reality! Start your working life with us and enjoy your work with interesting projects.

Megamenü_2023_Karriere-4-1

Students

You don't just want to study theory, but also want to experience it in practice? Check out theory and practice with us and experience where the differences are made.

Megamenü_2023_Karriere-3

Jobs

You can find all open vacancies here. Look around and submit your application - we look forward to it! If there is no matching position, please send us your unsolicited application.

Blog
NextLytics Newsletter Teaser
Sign up now for our monthly newsletter!
Sign up for newsletter
 

Create SAP Analytics Cloud hierarchies easily

With the introduction of the new Value Driver Tree widget, SAP has introduced an Excel template for the quick creation of value driver trees in SAP Analytics Cloud (SAC). However, the same approach can also be used to easily build structured hierarchies. At the same time, unique IDs are also created.

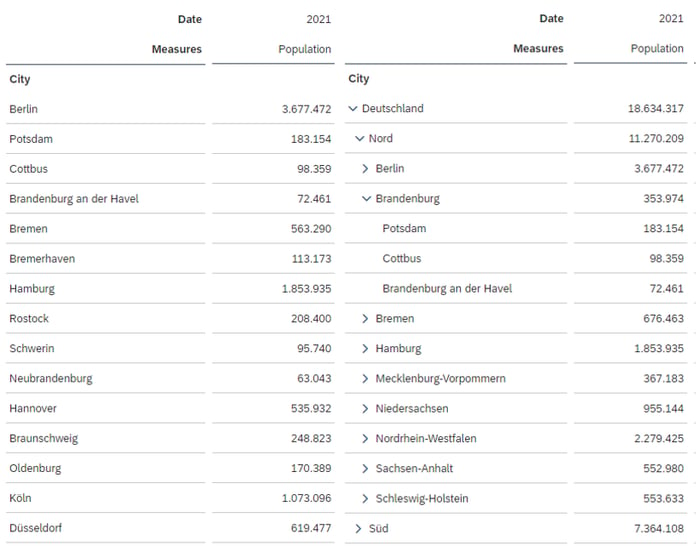
Since SAC aims to enable the business department to maintain master data and hierarchies independently, these are important criteria. This allows users to create graphical representations of ordered groupings on their own. An example of a hierarchical representation compared to a list representation can be found in the image below.

001-flat-vs-hierarchy_SAP Analytics Cloud hierarchies

The presented template is therefore a very useful aid. In this article we will explain the structure of the template step by step, so that you can make your own adjustments if necessary.

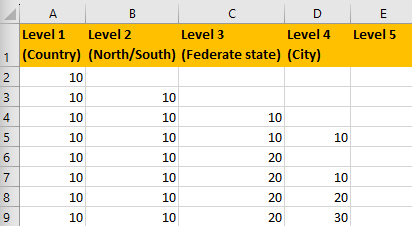
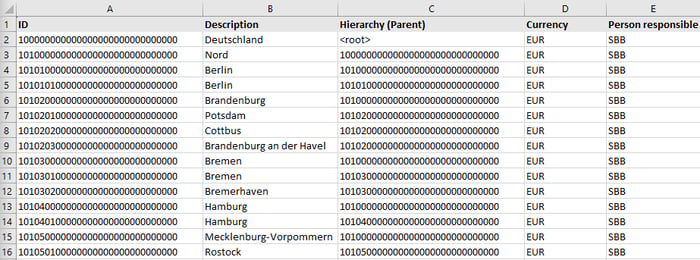
The first columns of the Excel spreadsheet are used to represent the levels of the hierarchy. You can enter a two-digit number (e.g. 10, 20 or 11, 12 etc.) per row and column. If a hierarchy level is not required, you do not need to enter anything.

002-levels_SAP Analytics Cloud hierarchies

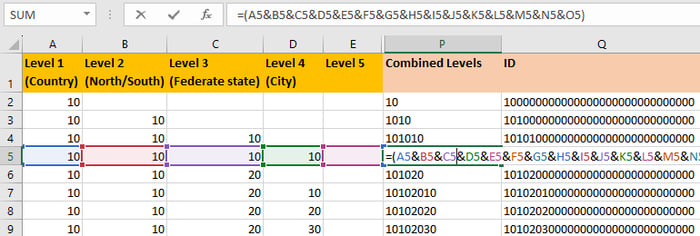
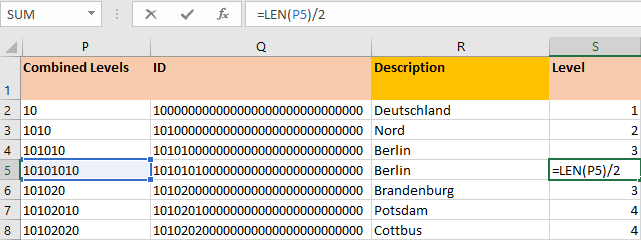
The values entered per level are concatenated using an Excel formula to generate a combined level.

003-combined-level_SAP Analytics Cloud hierarchies

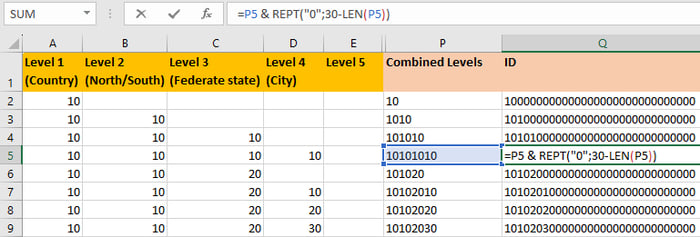
In the next step, the combined level is filled with zeros until the length of 30 characters is reached. This ensures a unique ID.

004-generated-id_SAP Analytics Cloud hierarchies

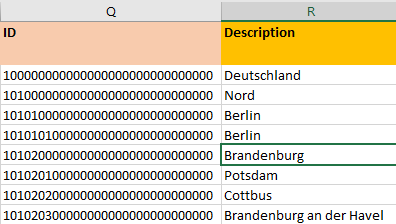
After the automatically generated ID, you just have to provide a description.

005-description_SAP Analytics Cloud hierarchies

Next, the level of the characteristic value is determined. This is required to determine the parent node later on. Since the levels of the individual value were always defined using a two-digit number, the hierarchy level can be calculated by dividing the length of the combined level by two. For example, it is clear that the combined level "10" represents the first hierarchy level, while the combined level "1010" represents the second hierarchy level.

006-level_SAP Analytics Cloud hierarchies


Dashboarding with SAP Analytics Cloud -
Download our whitepaper here!

SAP Analytics Cloud Whitepaper


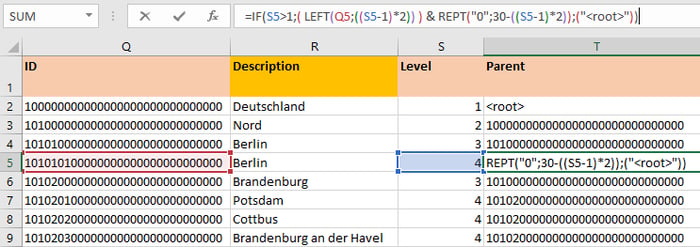
Finally, we determine the parent node. This is entered in the hierarchy definition in SAP Analytics Cloud. In the case of the first level, it is clear that this is the top node. In all other cases, we find out the top node by taking the number of characters corresponding to the level from the generated ID in the Q column.

Since we always use two characters to define the level, we can use the following formula: (level - 1 ) * 2

For example:

Level 2 - 1 = 1 * 2 = 2 characters → 10 corresponds to the parent level

Level 3 - 1 = 2 * 2 = 4 characters → 1010 corresponds to the parent level

Level 4 - 1 = 3 * 2 = 6 characters → 101010 corresponds to the parent level

Therefore, we take from the second level the first two characters (10) and the rest is filled with zeros (1000000000000000000000). This way we identify the parent node.

007-parent_SAP Analytics Cloud hierarchies

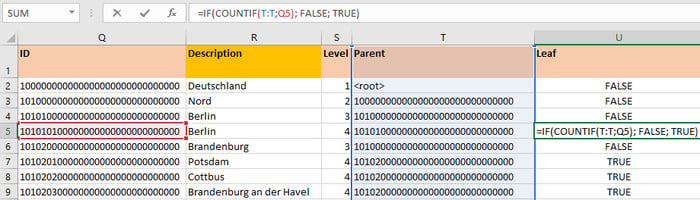
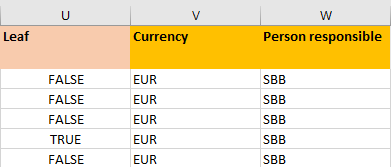
The next column checks whether the value is a hierarchy node or a leaf. Using the COUNTIF formula, we check whether the ID appears in the "Parent" column. If an ID is not found, it is not a node for other values, but a leaf.

008-leaf_SAP Analytics Cloud hierarchies

Last but not least, other attributes of the characteristic, such as currency and person responsible, can be entered.

009-attributes_SAP Analytics Cloud hierarchies

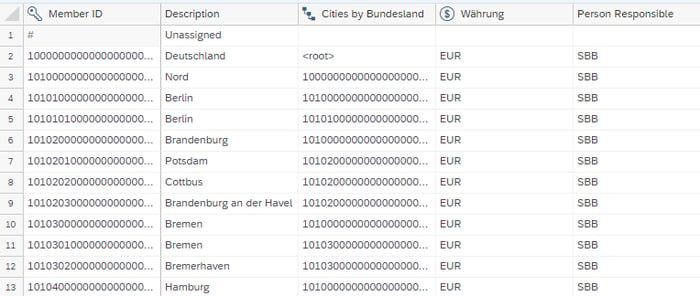
After the input has been completed, the second sheet of the workbook can be used. This worksheet puts all attributes in the order expected by SAP Analytics Cloud.

010-sac-structure_SAP Analytics Cloud hierarchies

This way, all the values can be easily copied and pasted into SAP Analytics Cloud. 

011-sac-view_SAP Analytics Cloud hierarchies

SAC Hierarchies - Our Conclusion

Hierarchies are an essential topic in reporting. To make reports more flexible, it is a good idea to use hierarchy nodes instead of individual values. If, for example, new values are added within the node, the changes are automatically reflected in the reports.

The prerequisite for this is that the hierarchy is consistent and easy to maintain. With the template presented, you have a tool at hand that greatly simplifies the creation of hierarchies. This means that users from the business department can also create hierarchies that cover their reporting requirements independently and without support from the IT department.

Do you have questions about this or other topics? Are you trying to build up the necessary know-how in your department or do you need support with a specific question? We will be happy to help you. Request a non-binding consulting offer today.

Learn all about SAC


avatar

Sebastian

Sebastian Uhlig has been consulting companies in various industries on SAP BI solutions at national and international level since 2001 and covers the range from requirements analysis to the implementation of complex solutions. He has experience in leading project teams and is the architect of the product NextTables. He enjoys mountain biking and watching American football games.

Got a question about this blog?
Ask Sebastian

Blog - NextLytics AG 

Welcome to our blog. In this section we regularly report on news and background information on topics such as SAP Business Intelligence (BI), SAP Dashboarding with Lumira Designer or SAP Analytics Cloud, Machine Learning with SAP BW, Data Science and Planning with SAP Business Planning and Consolidation (BPC), SAP Integrated Planning (IP) and SAC Planning and much more.

Subscribe to our newsletter

Related Posts

Recent Posts