In this article I will give you an overview about Power BI, the different solutions and licenses.
Although reports or extracts of data provide a detailed analysis, it is difficult to derive decisions from them. Dashboards help to speed up decision-making through compact and comprehensible visualization, provide a transparent basis for decision-making and convince through their connectivity to (real-time) data sources. To develop exactly such dashboards or reports, the use of Power BI is suitable.
What is Power BI?
Power BI is a self-service dashboarding tool from Microsoft that allows you to quickly and intuitively create your own dashboards and reports. The wide range of data connectivity options allows you to connect to different data sources, so that almost any use case can be covered. From data cleansing, to data modeling, to visualization, Power BI covers all the steps necessary to create reports and dashboards. The tool is aimed at power users (creating their own dashboards, connecting to data sources) or professional users.
Within the tool a distinction is made between reports and dashboards. Reports are built and visualized on data models (datasets). A Power BI Dashboard, on the other hand, is made up of different reports, i.e. individual visualizations of these reports can then be combined to form a dashboard.
Power BI Desktop, Pro and Premium
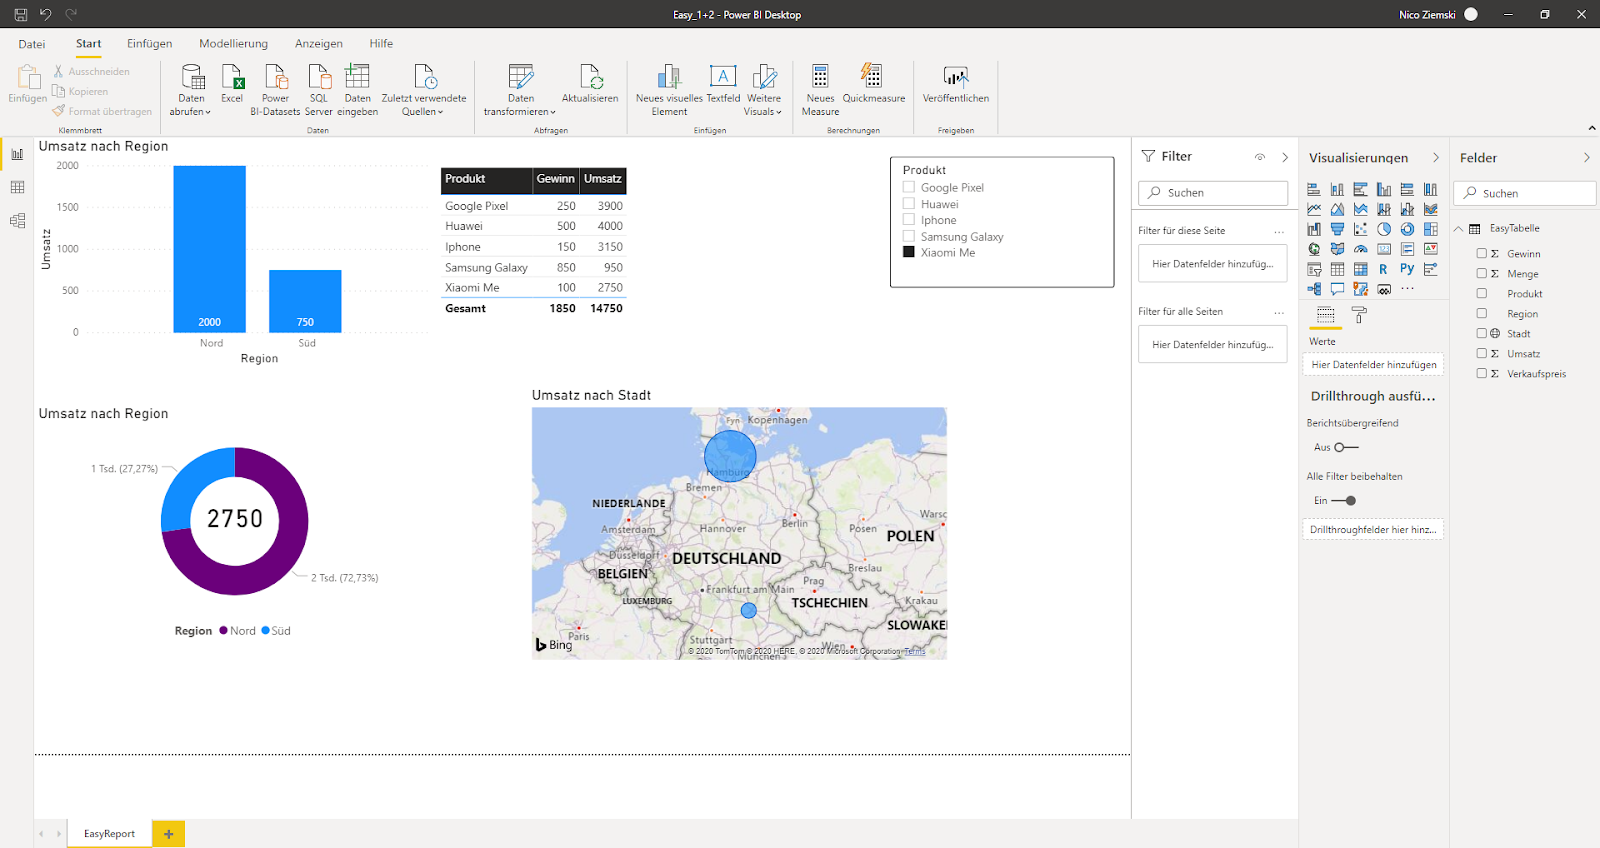
Power BI Desktop
As the name suggests, Power BI Desktop is installed on your own computer, executed from there and can be used free of charge in the entry-level version. Data is stored locally on the computer and processed in Power BI Desktop. In this variant it is already possible to connect other data sources in addition to Excel and CSV. As soon as the data is prepared, the user can create his own reports very quickly and intuitively. However, these reports can then be accessed locally and not centrally. Another limitation is that data is updated manually and not automatically. Furthermore, it is not possible to call up these reports via mobile devices.
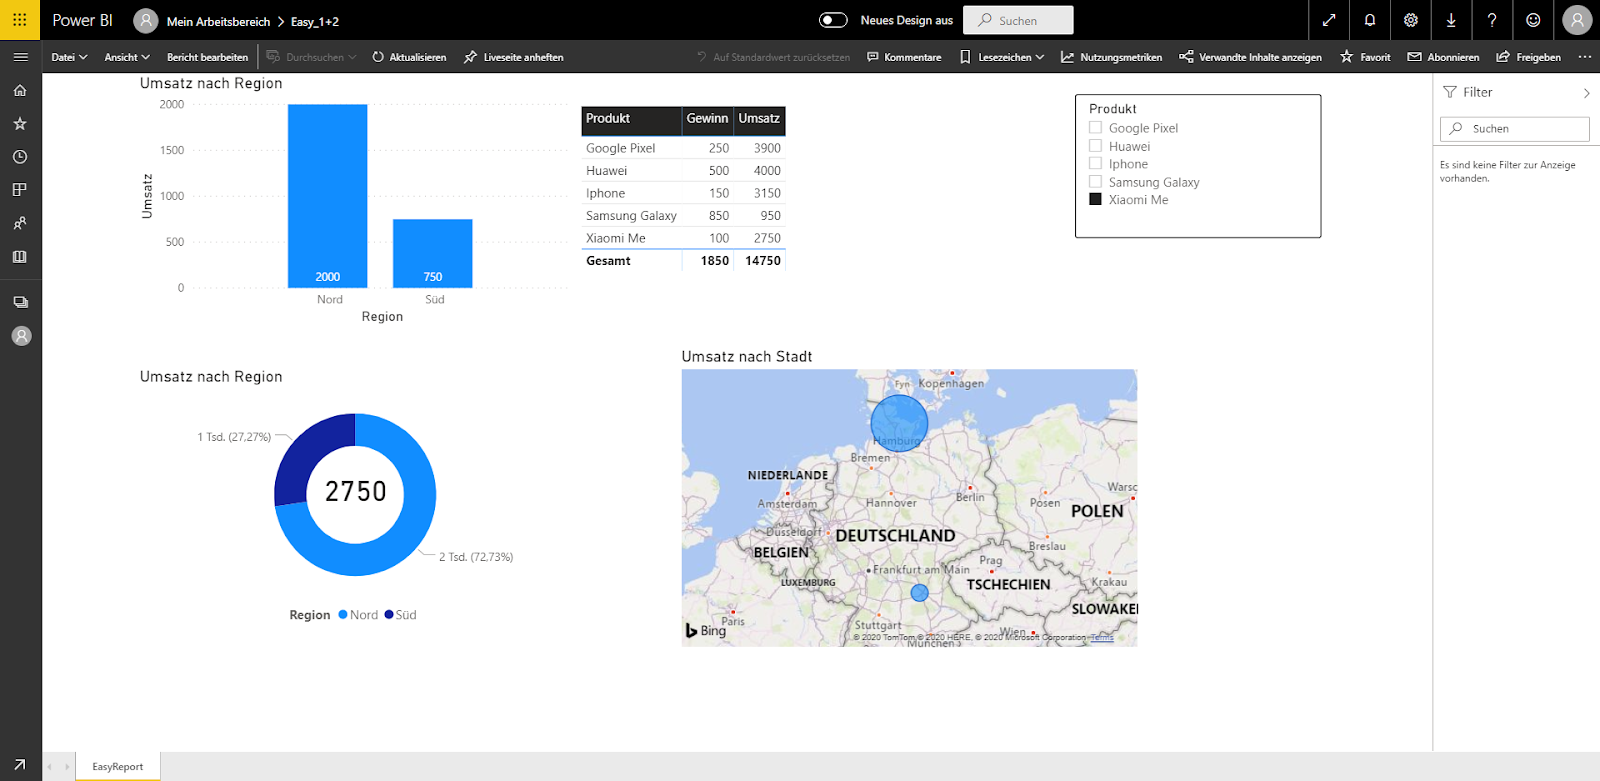
Power BI Pro
If reports are to be stored centrally, Power BI Pro is used. Reports and dashboards can be hosted in the Power BI cloud and stored there in a web platform. This means that the installed desktop version is no longer required for view mode and users can access the reports via their web browser. It is also possible to create dashboards from these reports in the cloud. With this variant, each user needs his own Power BI Pro license, which is paid monthly.
Dashboarding with SAP Analytics Cloud -
Download the Whitepaper here!

Power BI Premium
If you need dedicated capacity in addition to the benefits of Power BI Pro and don't want to store your data in a public cloud, Power BI Premium is available. You pay one license per year regardless of the number of users. In addition, you will be charged for the selection of capacities you choose.
Power BI in the corporate network
If reports are not to be stored in a cloud, the Power BI report server can be operated on-premise in your own network. This is different to Pro and Premium and provides less functionality. These include the lack of dashboard creation, real-time streaming or the different release cycle (3x yearly versus monthly). To use the report server, either Power BI Premium or SQL Server Enterprise Edition with Software Assurance is required.
With Power BI it is also possible to cover a hybrid approach. This means that local data can be connected with external data from the cloud. Sensitive data thus remains on the own computer, while less critical data is obtained from the cloud.
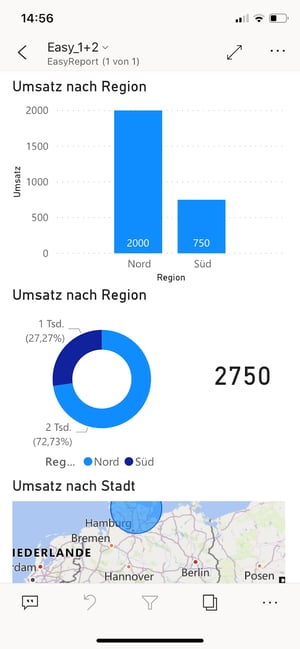
If the choice is Pro or Premium, mobile apps for Apple, Android and Windows 10 smartphones can be used to access reports and dashboards on the go.
Conclusion
With Power BI, you can quickly and intuitively create reports and even dashboards. Microsoft has launched a powerful dashboarding tool that can be integrated quickly and easily. Especially the typical functions from the Microsoft environment make it easy to get started. The selection of the ideal solution depends on your business context.
In the entry-level variant, the desktop version can be used free of charge. You can prepare, model, and visualize data at this stage. However, you can only call up these reports locally on your computer, and it is therefore not recommended.
If you want to share reports and dashboards with your employees, you have to use Power BI Pro. If you're running out of capacity in the public cloud, Power BI Premium with dedicated capacity is your first choice. If you don't want your data to leave your own network , the report server (Power BI Premium license or SQL Server Enterprise Edition with Software Assurance) is your first choice.
In addition to using Power BI Desktop, you can also access your reports and dashboards via the mobile application for smartphones or tablets. All you need is the usage of Pro or Premium licenses.
If you are interested in dashboarding and would like to learn more about it besides from Microsoft Power BI, you will find additional information on the following pages: