Sales planning is a hot topic for every business that engages in commerce. Acquiring insights about projected sales figures is deemed an important yet strenuous task. By effectively predicting sales, businesses can allocate resources more efficiently, ensuring that production and inventory levels are optimally balanced to meet demand. Accurate sales predictions also enable companies to set realistic revenue targets which are essential for financial planning.
Over the years, many methodologies have been developed in order to accurately forecast sales, ranging from simple statistical models to sophisticated machine learning algorithms, primarily designed for time series prediction. ARIMA models have been a useful tool for many decades in the hands of analysts and researchers that are tasked with providing business intelligence to the sales or supply chain department. Moreover, neural networks have been proven quite successful in adapting to the ever-changing nature of time series with the LSTM architecture being the most prominent.
In this article, we will present a complete framework for forecasting sales time series, comparing different models and methodologies, generating charts and reports while reaping the benefits of AzureML, a machine learning development & deployment platform that enables us to quickly prototype solutions, run tests and draw conclusions about monthly sales and revenue of individual products.
Framework architecture
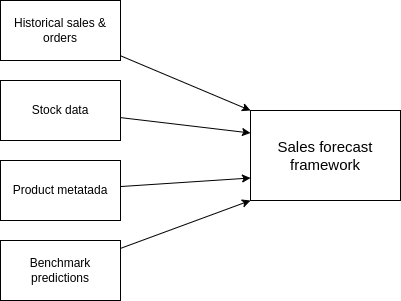
A time series prediction framework is basically an ETL pipeline with a few extra steps in between. Several data sources are utilized as input in the pipeline besides the historical sales of the products. Product metadata is useful to categorize products based on their attributes (similar products may display similar selling behavior). Also, a company may categorize products based on revenue, demand or overall significance. Additionally, stock information is very useful in determining the future sales patterns, since stock availability and sales figures are closely related. Finally, if planning data composed by other means exists, then it can serve as a benchmark for comparisons and assessment of the prediction quality.
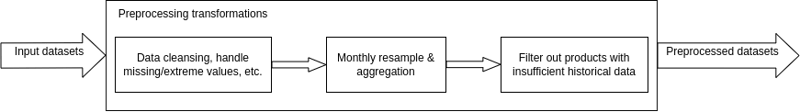
After loading the data, several preprocessing steps and transformations are taking place in order to ensure that the input datasets are ready to be fed into the machine learning models for training. In most cases, the historical sales data comes in the form of order records, where the product id, timestamp, number of units, price per unit and invoice number is recorded. These records might include missing or extreme values, so we can either choose to discard them completely or try to interpolate the missing values (e.g. by taking the mean of the daily records) and normalize the extreme values in a more suitable range. Order records are then resampled on a monthly basis per product, so the result will be numerous time series (one per product) representing the aggregate monthly sales, the aggregate units sold and the average price per unit. Stock records are also resampled monthly. After that, we have to make sure that a sufficiently large historical dataset is available for every product. Some of the training algorithms require at least two full years worth of training data in order to clearly identify patterns such as a yearly trend. In addition to that, a significant amount of data should be left out for validation purposes. So in this step, products that do not have sufficient data to work with are filtered out.
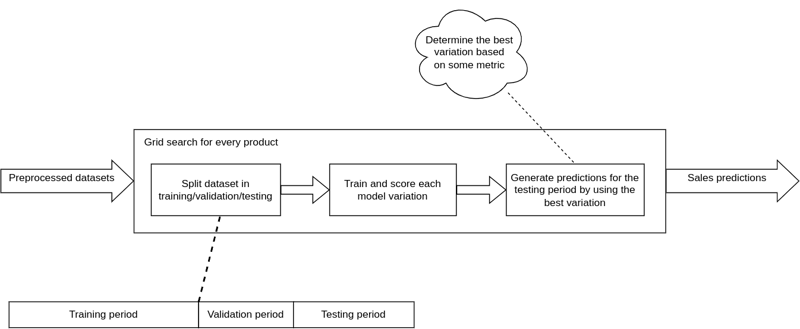
Now that the datasets are preprocessed, we move on with the model selection part where multiple statistical and machine learning models are tested in order to determine which one is the most suitable for every product. This procedure is called grid search and involves the continuous training & validation of different models across a set of algorithm hyperparameters. Basically, it is an exhaustive hyperparameter optimization method that guarantees to find and fine-tune the best forecast model. The criterion for scoring the different variations of models is usually an error metric such as MSE or MAPE; a small value indicates that the predictions are pretty close to the actual sales in the validation period. With a set of optimized models, we can generate predictions for every product in the test period. The diagram below outlines the grid search methodology.
How to advance your business through
Artificial Intelligence and Machine Learning

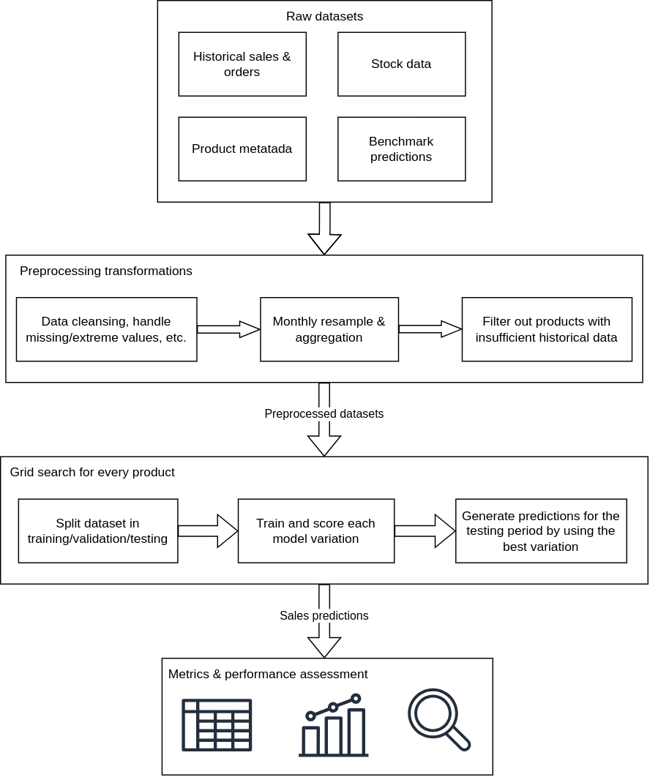
Predictions can now be used in order to assess the performance of the system in a more impartial way, since the metrics will be computed based on unseen before data points. At this point, we can generate plots, calculate additional metrics, compare with benchmarks and construct reports about individual products and product categories. The complete architecture is presented in the diagram below.
Deployment in AzureML
Despite its seemingly complex architecture, the framework is quite flexible and can be deployed on virtually any platform. To this extent, we choose AzureML for development and deployment. AzureML is a cloud-based service provided by Microsoft for building, training, and deploying machine learning models. It offers a wide range of tools to easily manage large datasets, use various machine/deep learning frameworks and automate workflows.
Azure Blob Storage facilitates the needs for efficiently storing and retrieving the raw input datasets as well as storing and versioning of different grid search run results and metrics. Forecast time series, charts and reports are also stored in Blob Storage. AzureML allows for prototyping and experimentation through the use of jupyter notebooks, so the development experience becomes much more interactive and collaborative. The deployed predictive models (used for real time forecasts) can be versioned and are accessible through REST endpoints.
The plot below demonstrates the performance of several different prediction models, in the context of grid search.
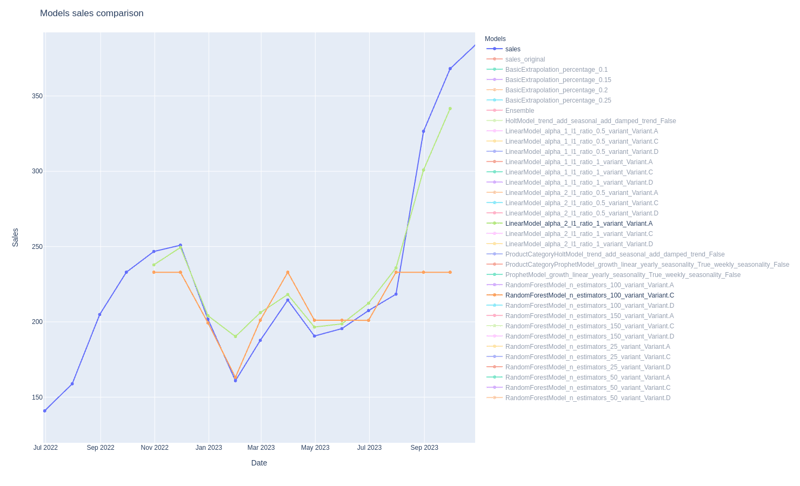
The blue line represents the true sales of a certain product, thus the values we want to predict. The light green line represents a variant of a linear regression model which happens to be the best model for this product. In contrast, a variant of a random forest (a popular ensemble ML algorithm) is represented with orange which does not seem to perform that well. Both models seem to get a grasp of the sales trend, but linear regression handles smoother the steep upward trend near the end of the prediction period. On the right side, you can see a list of all the available models but are omitted from the plot to avoid clutter.
In the table below, some of the performance metrics are compared between the two prediction models mentioned above.
|
MAE |
MAPE |
SMAPE |
R² |
|
|
Linear Regression |
12.305 |
0.0543 |
0.0528 |
0.9243 |
|
Random Forest |
27.844 |
0.0954 |
0.1059 |
0.2898 |
Clearly, linear regression dominates random forest in every metric. In terms of Mean Absolute Error (MAE), linear regression predicts ± 12.3 units off the target on average, whereas random forest predicts ± 27.8 units off the target. A more intuitive indicator is Mean Average Percentage Error (MAPE) which is again lower for linear regression; the interpretation is that the model predicts ± 5.28% off the target on average. R² or goodness of fit, is closer to 1 when the model performs well. In this case, linear regression has a R² score pretty close to 1, in contrast to random forest which is lacking in this regard.
Sales planning in AzureML - Our Conclusion
Sales forecasting is deemed a challenging task and for good reasons. Bad quality of data usually leads to false assumptions and projections that do not reflect reality. With a mixture of software engineering best practices and the flexibility that Azure provides, we developed a sales forecasting framework that leverages the capabilities of state-of-the-art machine learning algorithms for time series prediction. The grid search mechanism guarantees to produce specialized predictive models tailored to the products needs. The performance of the system is assessed by using metrics that measure how close the forecasts are to the real product sales. Moreover, interactive plots and reports are generated in order to provide a visual representation of the overall performance. By utilizing Azure Machine Learning for development & deployment, models can be retrained and stored along with important metadata and accompanying metrics and results.
Do you have questions about AzureML or other topics? If you would like to discuss your organizations’ specific needs, we are eager to learn about your challenges and happy to help finding and implementing optimal solutions.